
The salesman slid the paper across the desk like he was doing a favor. “$487 a month,” he said. “That’s less than your phone bill and a couple of dinners out.” The couple in the chairs nodded. They’d been nodding for two hours. The showroom smelled like fresh coffee and new carpet and something vaguely chemical that makes grown adults feel like they’ve earned something. They signed. They drove away in a $38,000 SUV. They had no idea what it actually cost them.
That scene repeats itself approximately 13 million times a year in the United States. Thirteen million new vehicle transactions, most of them built around one number — the monthly payment — while the real cost of owning a car sits buried in the fine print, the depreciation schedule, the insurance renewal notices, and the ten years of compound interest that never made it into the salesman’s pitch. The true cost of car ownership in America is one of the most successfully hidden financial facts in modern life, not because the numbers are hard to find, but because the industry that profits from that ignorance has spent decades making sure nobody looks.
AAA publishes a yearly study on the full cost of vehicle ownership. The 2023 edition put the average annual cost of owning a new car at $12,182 — or about $1,015 per month. That includes depreciation, financing, insurance, maintenance, registration, and fuel. Most people buying that $487/month car have budgeted for the payment. They have not budgeted for the other $528 also leaving their wallet every single month.
This article is the math the salesman didn’t show. Every number gets run, a Total Ownership Ledger gets built line by line, and what the same money compounds to gets shown once it stops getting donated to Detroit — plus a framework for making this decision in a way that serves an actual financial future instead of the dealership’s quarterly targets. The Total Ownership Ledger is the framework used throughout — every cost category stacked and totaled so the real number is impossible to ignore.
THE WAKE-UP: What Your Car Is Really Costing You
- Loan payment: $751/month
- Fuel: $175/month
- Insurance: $185/month
- Maintenance: $92/month
- Registration & taxes: $72/month
- Parking, tolls, misc: $50/month
- Total: $1,325/month
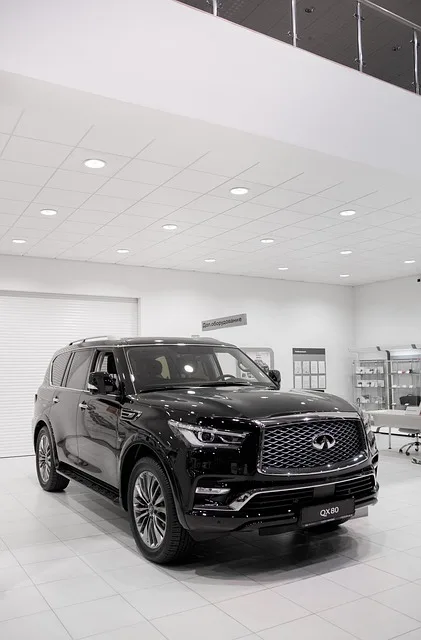
Here’s the full picture for a typical new car purchase. Take a $38,000 SUV, financed at 7.1% over 60 months (the current national average rate for a new vehicle loan, per Bankrate). Monthly payment: $751. Over five years, that’s $45,060 — $7,060 in interest alone. Now add what it actually costs to operate that vehicle. At 15,000 miles per year and 25 MPG at $3.50/gallon, fuel runs about $175 per month. Full coverage insurance on a new $38K SUV averages $175 to $200 per month depending on the state. Maintenance — even under warranty — runs $85 to $99 per month when averaging oil changes, tires, brakes, and wear items across the ownership period. Registration and taxes average $60 to $90 per month depending on state. Parking, tolls, and incidentals add another $40 to $60 per month in most metro areas.
Run the Total Ownership Ledger for that vehicle:
That’s $15,900 per year. For a household earning $75,000 gross, that’s 21% of gross income — or roughly 28% of take-home pay after federal and state taxes — for one vehicle. Most American households have two. If both are new, financed vehicles with similar profiles, that’s $31,800 per year, nearly 43% of gross income on transportation alone before rent, food, or utilities.
Now add the number nobody puts in the Ledger. That $38,000 vehicle will be worth approximately $15,200 when sold in five years. $45,060 will have been paid in loan payments to finance it. The depreciation alone — the value lost simply by existing and aging — represents $22,800 over that ownership period, or $380 per month on top of everything else. True, all-in monthly cost: roughly $1,705 per month. Over five years: $102,300. For a car.
The Monthly Payment is what gets sold. The Total Ownership Ledger is what actually gets paid. The gap between those two numbers is where financial goals go to die.
THE MATH: Building Your Total Ownership Ledger
Build the Ledger properly, category by category, with real numbers. Not an exercise in pessimism, this. An exercise in accuracy — because every dollar that can’t be seen is a dollar that can’t be managed.
Line 1: Depreciation
Depreciation is the single largest cost of owning a new vehicle, and it’s the one that never appears on any bill. A new vehicle loses approximately 9% to 11% of its value the moment it leaves the lot. By the end of year one, it’s lost 15% to 25% of its original price. By year five, 50% to 60%.
On a $38,000 vehicle, that first-year depreciation runs $7,600 to $9,500 — call it $700 to $790 per month, just for the depreciation component. Nobody talks about this number because no check ever gets written for it. But it’s absolutely a cost of ownership, because when the vehicle gets sold or traded in, it’s gone. Paid for with labor. Nothing received for it.
Compare that to a five-year-old version of the same vehicle, purchased used for roughly $15,200 (60% depreciated). That car has already absorbed the steepest portion of the depreciation curve. Year six and beyond, the same vehicle depreciates at roughly 10% to 12% per year — on a base of $15,200 instead of $38,000. Annual depreciation cost drops from $7,600+ to roughly $1,520 to $1,824. Monthly: $127 to $152. That’s the math behind why buying used consistently outperforms buying new on a pure cost-of-ownership basis.
Line 2: Financing Costs
The average new car loan in the United States now carries a term of 69 months — five years and nine months — at an average APR of 7.1% for new vehicles and 11.6% for used vehicles, per the Federal Reserve’s Q4 2023 Consumer Credit data. On a $38,000 purchase with 10% down ($3,800) and a 60-month term at 7.1%, total interest paid is $6,453. On a 72-month term, it climbs to $7,741. On an 84-month term (now representing 32% of all new car loans), it reaches $9,047 — plus payments continue into year seven on a vehicle that may be requiring significant repairs by year five.
There’s a brutal test embedded in loan term selection. Unaffordable on a four-year loan means unaffordable, period. Stretching to 84 months doesn’t make the car more affordable. It makes it more expensive, and keeps financial exposure — owing more than the vehicle is worth — active for a longer window. The average car goes underwater (loan balance exceeds vehicle value) within the first 18 to 24 months of a long-term loan, and stays there for years.
Line 3: Fuel
At 15,000 miles per year, fuel cost is entirely driven by two variables controlled at purchase: MPG and vehicle selection. The math is straightforward and most people never run it.
- 20 MPG at $3.50/gallon: 750 gallons × $3.50 = $2,625/year ($219/month)
- 25 MPG at $3.50/gallon: 600 gallons × $3.50 = $2,100/year ($175/month)
- 35 MPG at $3.50/gallon: 429 gallons × $3.50 = $1,500/year ($125/month)
The difference between a 20 MPG truck and a 35 MPG sedan over a five-year ownership period at $3.50/gallon: $5,625. At $4.50/gallon — standard in California, New York, and during supply disruptions — that gap widens to $7,245. A $7,000 decision gets made at the showroom floor without anyone knowing it, because nobody frames it that way. The monthly payment gets shown. The fuel spread does not.
Line 4: Insurance
- Depreciation: $380/month
- Loan payment: $751/month
- Fuel: $175/month
- Insurance: $168/month
- Running total: $1,474/month
Insurance is also not static. It ratchets upward over time independent of behavior. A driver with a clean record renewing with the same insurer can still see premiums rise 5% to 8% per year due to actuarial factors outside their control. Over a five-year ownership period, that compounding pushes a $168/month premium to roughly $205/month by year five — even if nothing bad happens.
The Total Ownership Ledger so far (new $38K vehicle, 25 MPG, average insurance):
Line 5: Maintenance and Repairs

Brand matters enormously here. A set of tires for a Honda CR-V: $500 to $700. For a BMW X3: $900 to $1,400. A brake job on a Toyota RAV4: $350 to $500. On a Mercedes GLC: $800 to $1,200. Not exotic vehicles, these — common crossover SUVs in similar price classes. The cost differential over ten years of ownership can easily reach $8,000 to $12,000. The vehicle brand chosen at purchase is a maintenance cost decision that plays out in slow motion for a decade.
Line 6: Registration, Taxes, Fees
State registration fees vary wildly. In Virginia, personal property tax on vehicle value gets paid annually — meaning a $38,000 vehicle carries a meaningful tax bill every year that declines as the vehicle depreciates. In California, registration on a new vehicle can run $500 to $800 in year one. Most states add annual registration fees of $150 to $400. Averaged nationally, expect $60 to $90 per month when including first-year sales tax amortization, annual registration, and title fees.
Complete Total Ownership Ledger — New $38K Vehicle:
- Depreciation (amortized): $380/month
- Loan payment (60 months, 7.1%): $751/month
- Fuel (25 MPG, $3.50/gal): $175/month
- Insurance (full coverage): $168/month
- Maintenance & repairs (avg): $99/month
- Registration, taxes, fees: $75/month
- Parking, tolls, misc: $50/month
- Total: $1,698/month | $20,376/year
That’s the real number. Not $487 a month. Not even $751 a month. $1,698 per month for the full cost of owning one average new vehicle in America today. Two vehicles at this profile: $3,396 per month — $40,752 per year — before a single mortgage payment, grocery run, or utility bill.
THE SYSTEM: The Vehicle Acquisition Framework
- 20% down. At least 20% of the purchase price down in cash or verified trade-in equity. A new $38,000 vehicle requires $7,600 down. This keeps a buyer from going underwater immediately — a new car depreciates approximately 9% to 11% the moment it leaves the lot, so a 20% down payment creates a buffer against that instant loss and keeps the loan balance below market value from day one.
- 4-year maximum loan term. Unaffordable on a four-year repayment schedule means more vehicle than income supports. A 72-month or 84-month loan doesn’t make a car affordable — it makes an expensive car feel affordable while adding thousands in interest charges and years of financial exposure. The 4-year ceiling is also a forcing function: if the four-year payment blows the budget, a less expensive vehicle is needed.
- 10% of gross income for total car expense. Combined monthly car payment and insurance premium shouldn’t exceed 10% of gross monthly income. On $70,000 per year ($5,833/month), the payment-plus-insurance ceiling is $583. At $150/month for insurance, the maximum loan payment is $433. Run that backward through a loan calculator with 20% down and a four-year term, and out comes the maximum purchase price. For a $70,000 income, that ceiling is approximately $20,000 to $22,000 for a used vehicle.
The alternative to overpaying isn’t complicated. Three stages: select for depreciation position, finance conservatively, drive to the end of useful life. Each stage is simple in theory and requires discipline in execution — because every stage has a salesman standing at the entry point, and his job is moving you to a more expensive decision.
Stage 1: Buy in the depreciation sweet spot
The optimal vehicle purchase targets cars three to five years old with 35,000 to 55,000 miles. At this point in the depreciation curve, the original owner has absorbed the steepest value loss (typically 40% to 50% of original MSRP). A vehicle with 60% to 70% of its useful life remaining gets purchased at 40% to 50% of the original price. Also past the point where the vehicle’s initial quality defects have surfaced — recalls, TSB issues, early-failure components — which means a pre-purchase inspection gives a much cleaner picture of what’s actually being bought.
The brands with the highest long-term reliability ratings — and therefore the lowest total maintenance cost over the ownership period — have been consistent across Consumer Reports and J.D. Power data for years: Toyota, Honda, Mazda, and Subaru dominate the reliability rankings. A five-year-old Toyota Camry or Honda Accord will typically deliver 100,000 to 150,000 miles of relatively low-drama operation if maintained correctly. A five-year-old German luxury vehicle at a similar price point will cost significantly more in parts, labor, and specialist shop rates across the same mileage.
Stage 2: The 20/4/10 rule — the only affordability framework worth running
The 20/4/10 rule has been around for decades, and it remains the clearest single test for whether a vehicle is actually affordable. It works like this:
The 20/4/10 rule is uncomfortable because it puts most new vehicles — and many used vehicles — out of reach for most incomes. The average new car transaction price hit $47,218 in late 2023 (Kelley Blue Book). Affording that under 20/4/10 rules requires a gross income of approximately $125,000 or more. The median household income in the United States is $74,580. The math doesn’t close, which is why 32% of new car loans now run to 84 months or beyond — people buying vehicles they can’t afford and stretching the payment into invisibility.
Stage 3: Drive to the end of useful life
The lowest total cost of ownership belongs to whoever buys a reliable vehicle, pays it off in four years, and then drives it payment-free for the next four to six years. Not a romantic lifestyle choice, this. Pure mathematics.
Here’s the Total Ownership Ledger for the same period — new vehicle versus disciplined used vehicle strategy:
Scenario A — New $38K vehicle, 60-month loan, traded at five years:
- Five-year all-in cost (Ledger calculation above): $102,000+
- Vehicle value at trade: $15,200
- Net five-year cost: ~$86,800
Scenario B — Five-year-old used version of same vehicle, purchased for $15,200, 48-month loan at 8.5%, driven 8 years total:
- Down payment (20%): $3,040
- Monthly payment (48 months, 8.5%): $282
- Fuel (same as above): $175/month
- Insurance (used vehicle, lower value): $120/month
- Maintenance (higher mileage, but Toyota/Honda reliability): $115/month
- Registration, fees: $55/month
- Parking, misc: $40/month
- Payment period (48 months) total: $787/month = $37,776 + down payment
- Payment-free period (48 more months) total: $505/month = $24,240
- Eight-year total: ~$65,056
Over the same eight-year window, Scenario A (buying new every five years, two purchase cycles) costs approximately $173,600. Scenario B (buying once, driving eight years) costs approximately $65,056. The difference: $108,544. From the same income. From decisions about a machine that drives you to the grocery store.
Stage 3 add-on: the pre-purchase inspection
Before buying any used vehicle, pay an independent mechanic — not the selling dealer’s service department — $100 to $200 for a pre-purchase inspection. A thorough inspection covers compression and leak-down testing, suspension and steering components, brake condition, tire wear patterns (which reveal alignment and suspension issues), transmission behavior, fluid conditions, and any evidence of frame damage or accident repair. One $150 inspection has a realistic probability of revealing $3,000 to $8,000 in latent repair needs. Skip it, and the gamble is on a machine that can’t be fully assessed from a test drive and a Carfax report.
THE TRAP: How the Industry Makes Overspending Feel Inevitable

The tactics are worth naming, because once the mechanism is visible, the emotional pull weakens significantly.
Trap 1: The Payment Frame
The payment frame is the industry’s most powerful tool. Nobody walks into a dealership and says “I’d like to spend $47,000.” They say, “I can handle around $600 a month.” The moment a monthly payment gets anchored, the salesman controls everything else: the price, the term, the trade-in value, the interest rate, the add-ons. He can hit that $600/month number with a $32,000 vehicle on a 48-month loan, or with a $47,000 vehicle on an 84-month loan. Same monthly payment. Wildly different total cost. The tool that breaks this trap is the Total Ownership Ledger — built before ever speaking to a salesman, anchored on total purchase price and total five-year cost, never on monthly payment. Know the ceiling before arriving. Write it on a card. When the conversation drifts toward monthly payment, bring it back to purchase price.
Trap 2: The Status Signal
Automotive advertising doesn’t sell transportation. It sells identity. Ram trucks sell the image of self-sufficient ruggedness. BMW sells precision and ambition. Tesla sells environmental righteousness and early-adopter sophistication. None of these are about getting from point A to point B. They’re about how a driver wants to be perceived, and they’re highly effective at triggering a willingness to pay a premium for a feeling. The premium ranges from $5,000 to $15,000 over a functionally equivalent vehicle — and that premium evaporates with depreciation at the same rate as the rest of the car’s value, leaving nothing except the memory of how it felt to pull into the parking lot the first week.
A minimalist approach to transportation — choosing reliable over impressive, efficient over prestigious — is not a sacrifice. It’s a recognition that the people nearby are thinking about their own cars, not yours, approximately 99% of the time.
Trap 3: The Two-Car Default
Most American households treat two-car ownership as a baseline, as automatic and non-negotiable as electricity. Worth questioning that assumption, at minimum, before accepting it. If one partner works remotely, commutes by transit, or has a commute under three miles, the second vehicle might represent $15,000 to $20,000 per year in ownership costs for a machine that sits in the driveway 22 hours per day. The calculation worth running: what’s the actual annual cost of the second vehicle on the Total Ownership Ledger, versus the annual cost of car-sharing, rideshare, and occasional rental for the trips that actually require it?
For households where the second vehicle is genuinely necessary, the strategy is still clear: never carry two car payments simultaneously. Pay off the first vehicle before financing the second. Every month with two payments carried is a month where the emergency fund stays flat, investments get shortchanged, and financial margin against a job loss or medical event shrinks from both directions at once.
Trap 4: The Upgrade Cycle
The industry has successfully normalized a five-year ownership cycle by making lease terms and loan terms converge at exactly that window. When the loan is paid off, or the lease expires, the dealership is ready with the next transaction. Walk in with equity, or walk in with a paid-off car, and either converts into a down payment on a new depreciating asset. Every five-year cycle resets exposure to the steepest part of the depreciation curve.
Breaking the cycle means making a deliberate decision to extend ownership past the point where the industry considers you a good customer. A paid-off vehicle driven for three to five years beyond the payoff date is financially one of the best investments available to a middle-class household. Every payment-free month represents $700 to $1,000 in transportation cost reduction, redirectable to compounding assets instead of depreciating ones. That redirection, sustained over years, is the mechanism by which ordinary incomes build extraordinary wealth.
THE PROOF: What the Numbers Compound to Over Time
- After 10 years: $211,000
- After 20 years: $793,000
- After 27 years (to age 55): $1,820,000
Run two career trajectories. Same starting income, same raises, same investment horizon. The only variable is the car decision.
Person A: New Car Every Five Years
At age 28, Person A buys a new $38,000 vehicle. Total five-year all-in cost (Ledger): $102,000. At age 33, trade-in equity of $15,200 goes toward a new $42,000 vehicle (average price has risen). Total five-year all-in cost of second vehicle: $108,000. At age 38, same cycle, third vehicle, $46,000 purchase. By age 55 — a 27-year window — Person A has owned five vehicles, spending approximately $540,000 in total ownership costs across that period. Current vehicle at 55: worth roughly $18,000 after five years on a $46,000 purchase.
Net lifetime transportation spend, excluding any payment-free periods: over $500,000.
Person B: The Vehicle Acquisition Framework
At age 28, Person B buys a three-year-old used vehicle for $16,500. Total four-year loan cost with insurance, fuel, maintenance: approximately $42,000. Pays off at age 32. Drives payment-free for five years, total operating cost (no loan): approximately $27,000. At age 37, buys another five-year-old reliable vehicle for $18,000. Four-year loan cost: approximately $46,000. Pays off at 41. Drives payment-free to age 47. Another purchase cycle. By age 55, Person B has made three vehicle purchases, spent approximately $165,000 in total ownership costs, and driven payment-free for approximately 14 of the 27 years. Net lifetime transportation spend: approximately $165,000 versus $500,000+.
The Investment Differential
Apply the $335,000 difference. Invest Person B’s monthly transportation savings — roughly $1,040 per month — into a low-cost index fund returning the historical S&P 500 average of approximately 10% annually, and the compounding looks like this:
Same income. Same career. One different category of recurring spending decision. The gap between those two people at age 55 is not a gap in ambition, intelligence, or work ethic. It’s a gap in what transportation was decided to be worth. Person A has a car he’s proud of and a net worth shaped partly by $500,000 in evaporated metal. Person B has a car that gets him everywhere Person A goes, and a brokerage account approaching retirement-ready.
This is what financial planners call opportunity cost, and it applies to every dollar that flows through anyone’s hands. Dollars directed at depreciating assets cannot compound. Dollars directed at appreciating assets do. The car decision is large enough, and recurring enough, to be among the most consequential financial decisions most people make — and most people make it based on how the car feels in the first ten minutes of a test drive.
The Total Ownership Ledger doesn’t eliminate that feeling. But it puts a number next to it, which makes it possible to decide whether the feeling is worth the price.
THE FAQ: Your Car Ownership Cost Questions Answered
What is the actual average cost of owning a car per year in the United States?
AAA’s 2023 Your Driving Costs study puts the average annual cost of owning and operating a new vehicle at $12,182, or approximately $1,015 per month. This covers depreciation, financing, insurance, maintenance, fuel, and registration. Small sedans come in lower (around $8,900/year) and large trucks higher (around $14,800/year). These figures use AAA’s methodology for a vehicle driven 15,000 miles annually. Most financial planning tools undercount this by excluding depreciation, which can represent $3,000 to $8,000 per year on its own for newer vehicles.
How much of my income should I spend on a car?
The 20/4/10 rule offers the most conservative and time-tested benchmark: combined car payment and insurance shouldn’t exceed 10% of gross monthly income. On a $70,000 income ($5,833/month), that ceiling is $583 for payment plus insurance combined. Including all vehicle operating costs — fuel, maintenance, registration — in the 10% ceiling (a stricter version of this rule) drops the maximum purchase price substantially. The difference between the conservative rule (payment + insurance only) and a strict total-cost rule is approximately $200 to $300 per month, depending on vehicle choice.
Is it better to buy new or used from a total cost perspective?
Used wins on total cost of ownership in almost every scenario, for one overriding reason: depreciation. A new vehicle loses 15% to 25% of its value in the first year and 50% to 60% in the first five years. The buyer of a five-year-old vehicle at 40% to 50% of original MSRP has effectively had that depreciation cost transferred away from them, onto the original owner. The used buyer’s annual depreciation cost on the same vehicle runs $1,500 to $2,200 per year versus $7,000 to $9,000 for the new buyer. Over a five-year ownership period, that differential alone is worth $25,000 to $35,000 — money that could instead be sitting in a low-cost index fund compounding. The used vs. new cost comparison is not close.
What is the cheapest way to own a car long-term?
Buy a three-to-five-year-old vehicle from a brand with top-tier reliability ratings (Toyota, Honda, Mazda lead most rankings), finance it with a four-year loan using 20% down, carry full coverage only as long as required by the lender, then drop to liability-only once the vehicle is paid off and its value no longer justifies comprehensive coverage premiums. Drive the vehicle until repair costs start approaching or exceeding the vehicle’s market value — typically 150,000 to 200,000+ miles on a well-maintained Japanese domestic market vehicle. Every year of payment-free driving on a reliable used vehicle saves $700 to $1,000 per month compared to carrying a new car loan. The highest-return, lowest-risk financial move available to most middle-income households.
How much does car depreciation actually cost per month?
On a new $38,000 vehicle, first-year depreciation runs approximately $7,600 to $9,500, or $633 to $792 per month — more than many people’s loan payments. Depreciation slows but doesn’t stop: years two through five average roughly $4,000 to $6,000 per year on a vehicle in this price range. Amortized across a 60-month ownership period, that’s approximately $380 to $500 per month lost to depreciation alone, independent of any loan payment, insurance, or operating cost. This cost is invisible until a sale or trade-in, at which point it shows up as the gap between what was paid and what the vehicle is worth. The Total Ownership Ledger makes it visible in advance, so it can inform the purchase decision rather than surprise anyone at disposition.
Should I pay cash for a car or finance it?
Cash purchases eliminate financing costs entirely and give maximum negotiating use — dealers prefer financing customers because they earn back-end profit on interest rate spread, so a cash buyer can often negotiate a lower purchase price. However, if cash on hand earns more than the loan interest rate — possible while carrying a low-rate loan and investing the difference in equity markets — financing at a low rate while keeping cash invested is mathematically superior. At current used vehicle loan rates (8% to 12% range), cash purchase beats financing for most buyers unless there’s confidence in sustaining market returns above the loan rate. The invest versus pay off debt calculation applies directly here. When in doubt, pay cash and eliminate the risk entirely.
How does the two-car household change the math?
Dramatically. A two-vehicle household where both are new financed vehicles carries a Total Ownership Ledger of approximately $3,396 per month — $40,752 per year — based on the single-vehicle breakdown above. At the median U.S. household income of $74,580, that’s 54% of gross income and roughly 73% of after-tax take-home pay consumed by transportation before housing costs. The mitigation strategy is staggered purchases (never carry two car payments simultaneously), aggressive use of the paid-off period before replacing either vehicle, and honestly evaluating whether the second vehicle earns its keep based on actual annual usage and the availability of alternatives. Use the same Total Ownership Ledger for each vehicle separately, stack the two totals, and compare the combined number to what that money does if redirected to wealth-building vehicles instead.
The Practical Framework: Applying Much Does Owning Car In Real Life
Editorial StandardsCorrectionsMedical DisclaimerAbout Our ContentAffiliate DisclosureSite Map