
Elena was 34, no diabetes diagnosis, perfectly normal fasting glucose at her annual physical. Her doctor called her “metabolically healthy.” Then she spent $299 on a continuous glucose monitor — partly out of curiosity, partly because a podcast she’d been listening to wouldn’t stop talking about it — and wore it for two weeks. What she found disturbed her. After her usual breakfast of steel-cut oatmeal with almond milk and a banana, her glucose hit 182 mg/dL.
After a glass of orange juice with lunch, it touched 194 mg/dL. Numbers that, in any medical context, would classify her as pre-diabetic. Her fasting glucose was fine. Her doctor’s tests showed nothing wrong. But her post-meal response was telling a completely different story about what was happening inside her body — a story her annual labs were never designed to capture.
This is the central promise and the central controversy of continuous glucose monitoring for people without diabetes. The technology exists. The data is available. The question — still genuinely unsettled in the medical literature — is what to do with it, whether it reliably predicts anything meaningful, and whether the anxiety it generates does more harm than the insights it provides.
The honest answer: it depends enormously on how you use it, and what questions you’re actually trying to answer.
What a CGM Actually Measures (And What It Doesn’t)
A continuous glucose monitor measures interstitial fluid glucose — the glucose concentration in the fluid surrounding cells in subcutaneous tissue, not directly in the bloodstream. This is a critical distinction that most consumer-facing CGM marketing glosses over, because it has real implications for how to interpret the numbers.
There’s a physiological lag between blood glucose and interstitial glucose, typically 5-15 minutes. When blood glucose is rising rapidly — after a meal — interstitial glucose lags behind blood glucose. When blood glucose is falling — after exercise — interstitial glucose may read higher than actual blood glucose. During periods of stable glucose, the lag matters little. During periods of rapid change, it matters a great deal.
Modern sensors are calibrated using factory-preset algorithms validated against capillary blood glucose (fingerstick). The Dexcom G7, Abbott FreeStyle Libre 3, and Medtronic Guardian 4 all achieve MARD (mean absolute relative difference) values of 8-10% against reference blood glucose. Sounds precise. But it means a sensor reading of 100 mg/dL could reflect actual blood glucose anywhere from 90-110 mg/dL. At glucose extremes, particularly at low values, this error can be clinically relevant.
The sensor also doesn’t read absolute blood glucose values the way a clinician would see them from a venous draw. If you’re comparing your CGM numbers to hospital reference ranges or diabetes diagnostic criteria, you need to understand that CGM readings consistently run 5-10% lower than simultaneous venous plasma glucose in many studies — the gold standard against which clinical thresholds are defined.
The 180 mg/dL spike Elena saw on her CGM after oatmeal might correspond to a venous plasma glucose of 170-190 mg/dL. That difference matters when you’re trying to apply clinical diagnostic thresholds to consumer device data.
Hydration, pressure on the sensor, temperature, acetaminophen (a known interferent with some older sensors), vigorous exercise causing interstitial fluid disruption, and altitude all affect CGM accuracy. Using a CGM as if it were a laboratory instrument — interpreting single data points with clinical precision — is a misuse of the technology. The value is in patterns over time, not individual readings.
The Glycemic Variability Hypothesis: CGM Actually Measures: What The Evidence Reveals
The scientific case for CGM in non-diabetics rests substantially on the glycemic variability hypothesis: the idea that fluctuations in blood glucose — the amplitude and frequency of glucose spikes and troughs — cause harm independent of average glucose levels. This is a plausible and partially supported hypothesis that has, in the wellness industry, been transformed into an essentially unfalsified dogma. The nuance matters.
The mechanistic case is reasonable. Post-meal glucose spikes trigger oxidative stress and endothelial inflammation through several pathways: glycation of proteins, activation of protein kinase C, increased flux through the hexosamine and polyol pathways. The DECODE study and STOP-NIDDM trial showed that post-meal glucose excursions predicted cardiovascular events independently of fasting glucose and A1C in populations with impaired glucose tolerance. These studies are real, and the associations are meaningful.
However, the existing human evidence for glycemic variability as an independent cardiovascular risk factor is primarily in people with established pre-diabetes or diabetes — populations where baseline glucose metabolism is already impaired. Extrapolating this to metabolically healthy individuals with normal glucose metabolism requires a leap the current evidence doesn’t fully support.
A landmark 2023 study published in Nature Medicine — the AEGIS study — put CGM sensors on over 800 individuals without diabetes and characterized their normal glycemic patterns. The key finding: metabolically healthy individuals spent approximately 96% of their time with glucose between 70-140 mg/dL, with occasional excursions above 140 mg/dL (classified as “prediabetic range” by clinical thresholds) occurring in the majority of healthy participants after certain meals.
The study concluded that brief, transient excursions above 140 mg/dL in non-diabetics are normal physiological responses, not harbingers of disease.
This directly challenges the narrative promoted by much of the wellness CGM industry, where any glucose above 140 mg/dL is treated as pathological and requiring dietary intervention. The biological reality is messier: the context, duration, frequency, and return-to-baseline speed of glucose excursions all matter.
A spike to 175 mg/dL that returns to 90 mg/dL in 90 minutes is physiologically different from a sustained elevation of 155 mg/dL for 3 hours — even though both might look alarming on a CGM graph.
What Healthy Glucose Patterns Actually Look Like
One of the genuine values of population-level CGM research in non-diabetics is establishing what “normal” actually looks like — information that was essentially unavailable before CGM technology existed, because no one was measuring continuous glucose in healthy people.
The Freestyle Libre sensor study published in Diabetes Technology & Therapeutics in 2019 put sensors on 153 non-diabetic adults and tracked them for two weeks. Mean glucose was 99 mg/dL. Time in the standard 70-140 mg/dL range was 93.2%. Average post-meal glucose peaked at 132 mg/dL and returned to baseline in approximately 2 hours. Standard deviation of glucose — a key variability metric — was approximately 15-16 mg/dL.
Subsequent studies have refined these numbers. A Stanford CGM study in healthy adults found that even in non-diabetics, individual post-meal glucose responses varied enormously — by up to 150% between individuals eating the identical meal. The Weizmann Institute’s landmark Personalized Nutrition Project (published in Cell, 2015) showed that glucose responses to identical foods were essentially unpredictable based on the food alone, and were shaped by gut microbiome composition, genetics, meal timing, prior activity, and sleep quality.
Two people could eat the same meal; one spiked to 185 mg/dL, the other barely moved above 110 mg/dL.
What does this mean practically? First, that aggregate glycemic index tables — the standard tool for predicting food’s glucose impact — are poor predictors of individual responses. Second, that personal glucose data from a CGM potentially contains genuinely actionable information about an individual’s food-glucose relationship that population-level dietary guidelines cannot provide. Third, that comparing CGM numbers against someone else’s tells you almost nothing useful about relative health.
Sleep quality has a profound effect on next-day glucose metabolism. A single night of sleep restriction to 4 hours reduced insulin sensitivity by 25% in healthy young adults in a controlled study at the University of Chicago. CGM users can observe this directly: glucose after the same breakfast meal on 8 hours of sleep versus 5 hours of sleep will often differ by 20-40 mg/dL, with post-sleep-deprivation values consistently higher.
This is a CGM insight with genuine practical value. And it has nothing to do with food choices.
Exercise: The Most Dramatic and Informative CGM Data

Aerobic exercise at moderate intensity — a 45-minute run at 65-70% of max heart rate — reliably drops blood glucose in non-diabetics, typically by 20-40 mg/dL, as working muscles consume glucose rapidly. This is expected and well-understood. What surprises most first-time CGM users is what happens with different exercise types.
High-intensity interval training (HIIT) and heavy resistance training paradoxically raise blood glucose, sometimes dramatically. A maximal sprint, a heavy deadlift set, an intense interval workout — each triggers a massive catecholamine (adrenaline, noradrenaline) surge that drives rapid glycogenolysis, liver glucose output, which can push blood glucose up 40-80 mg/dL within minutes of the most intense efforts.
CGM users who see their glucose spike to 160-180 mg/dL during a hard CrossFit workout and conclude something is wrong are witnessing a completely normal and healthy physiological response. The glucose returns to below-baseline within 30-60 minutes post-exercise as muscles replete their glycogen stores.
This exercise-induced glucose spike is not harmful and does not indicate insulin resistance. Studies using hyperinsulinemic-euglycemic clamp — the gold standard for measuring insulin sensitivity — show that individuals who demonstrate the largest exercise-induced glucose spikes during HIIT are not less insulin-sensitive; in fact, they often have greater muscle mass and better glucose disposal capacity at rest. The spike reflects physiological mobilization, not pathological dysregulation.
Walking after meals is one of the most effective and evidence-supported interventions for blunting post-meal glucose excursions. A 2022 meta-analysis in Sports Medicine showed that a 10-15 minute walk within 30 minutes of eating reduced post-meal glucose area under the curve by approximately 22% compared to sedentary post-meal rest. For CGM users, this effect is visible and dramatic — turning a 40-point post-meal rise into a 20-point rise through a simple intervention.
This is exactly the kind of feedback loop that makes CGM useful for behavior change.
Stress, Cortisol, and the Glucose-Anxiety Connection
One of the most underappreciated CGM insights for non-diabetics involves the glucose effects of psychological stress — and the potentially ironic relationship between wearing a CGM and the very metabolic disruption it’s supposed to prevent.
Cortisol, the primary stress hormone, is glucocorticoid by name and action. It stimulates gluconeogenesis in the liver, reduces insulin sensitivity in peripheral tissues, and raises blood glucose. Evolutionarily sensible — prepare the body for fight or flight by mobilizing glucose. But in the context of modern chronic psychological stress, it means work deadlines, relationship conflicts, traffic, and existential anxiety all raise blood glucose.
CGM users can observe this in real time. Research using paired CGM and cortisol measurements in non-diabetic adults has shown that acute psychological stressors — laboratory-induced social evaluative threat, public speaking tasks, anticipatory stress — raise glucose by 10-30 mg/dL independently of any food intake. The magnitude correlates with cortisol response.
Here’s the irony: several wellness practitioners and researchers have raised concerns that wearing a CGM creates its own anxiety feedback loop. See a glucose spike, get anxious about the spike, which raises cortisol, which further elevates glucose, which increases anxiety. A 2023 qualitative study in BMJ Open interviewing non-diabetic CGM users found that 34% reported heightened food anxiety, orthorexic tendencies, or increased worry about numbers their own physicians assured them were normal.
The device designed to reduce disease risk was generating psychological harm in a significant minority of users.
This doesn’t mean CGMs are harmful for non-diabetics. But it does mean the decision to wear one should be accompanied by clear frameworks for interpretation — what numbers to actually act on, what’s normal variation, and when to consult a clinician versus when to simply accept that a data point isn’t clinically meaningful.
Sleep Quality and Glucose: The Underappreciated Connection
Sleep’s impact on glucose metabolism is one of the most robustly replicated findings in metabolic research, and CGM provides a real-time window into this relationship that no other consumer-accessible tool can match.
The overnight CGM tracing in a healthy person should show stable, low glucose — typically 80-90 mg/dL — with a gradual rise beginning in the early morning hours as cortisol levels begin climbing toward their daily peak at approximately 8 AM. This dawn phenomenon is normal and mild in non-diabetics (typically a 10-15 mg/dL rise) and substantially larger in people with impaired glucose metabolism.
Disrupted sleep architecture — fragmented sleep, inadequate slow-wave sleep, obstructive sleep apnea — creates characteristic CGM patterns. Intermittent hypoxia from sleep apnea activates the sympathetic nervous system and raises cortisol and catecholamines, driving glucose upward. Studies using polysomnography combined with CGM have shown that people with untreated severe sleep apnea spend significantly more time above 140 mg/dL overnight than matched controls without apnea, and CPAP therapy reduces this glucose elevation.
For people investigating metabolic health through CGM, the overnight pattern is diagnostically rich. Consistently elevated fasting glucose (above 100 mg/dL), slow return to baseline after meals, or glucose instability during the night (oscillating without clear meal-related cause) all warrant discussion with a physician, regardless of whether fasting glucose on a lab test would raise flags.
Shift workers offer a natural experiment in the glucose-sleep relationship. Population studies consistently show higher rates of type 2 diabetes, obesity, and metabolic syndrome in night-shift workers, and CGM studies in shift workers versus day workers eating identical diets demonstrate significantly higher post-meal glucose excursions during shift work. The circadian disruption itself — not just what or when people eat — fundamentally impairs glucose metabolism.
Personalized Nutrition: The Most Evidence-Supported Application

The Weizmann Institute’s Personalized Nutrition Project, tracking 800 individuals over one week with CGM plus detailed dietary records, stool microbiome sampling, and comprehensive blood panels, showed that glycemic index — the standard population-level tool for predicting food’s glucose impact — predicted only 12% of the variance in individual glucose responses. The remaining 88% was explained by individual factors: gut microbiome composition (the largest single predictor), genetics (particularly glucose metabolism gene variants), meal timing, sleep quality, and prior activity.
The clinical implication is significant. A food that reliably spikes someone’s glucose to 190 mg/dL — but causes no more than a 120 mg/dL peak in someone else — is a food worth that person avoiding, regardless of its glycemic index classification. Conversely, a food with a moderate glycemic index might cause minimal individual response and can be freely consumed.
The mechanistic pathway through the gut microbiome is particularly interesting. Specific bacterial species produce short-chain fatty acids that improve insulin sensitivity, while other bacteria produce metabolites that impair it. The microbiome composition essentially filters how dietary carbohydrates enter the circulation — same food, different microbiome, different glucose response. This helps explain why fermented foods, which modify microbiome composition, show glucose-improving effects in CGM studies that go beyond their direct carbohydrate content.
Practical application: use the first CGM two-week period as a systematic self-experiment. Eat a normal diet for week one and identify which specific meals drive the largest glucose excursions. In week two, test modifications: different portions, different food combinations, different meal timing, post-meal walks. Use the data to build a personal food map that reflects individual biology, not someone else’s. This is genuinely personalizable precision nutrition — and it’s the most valuable thing a consumer CGM can provide.
Insulin Resistance Detection: Can CGM Catch It Early?
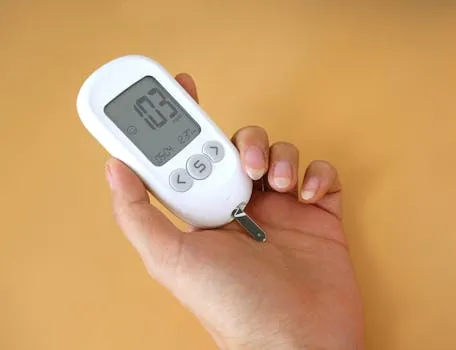
Insulin resistance develops years before fasting glucose or A1C becomes abnormal. During this compensated phase, the pancreas works harder to maintain normal glucose levels — secreting 3-5 times normal insulin — but glucose stays “normal.” Conventional tests look only at glucose and see nothing wrong. The problem is invisible until the pancreas can no longer compensate and glucose finally rises.
CGM, in theory, could detect the earliest signs of decompensating insulin resistance by showing that post-meal glucose is higher than expected for the food consumed, that glucose returns to baseline more slowly than normal, and that fasting glucose is creeping upward over serial sensor sessions.
A 2021 study in Diabetes Care showed that CGM metrics — specifically time spent above 140 mg/dL and glucose variability indices — predicted progression to pre-diabetes over a 3-year follow-up period in a cohort classified as normoglycemic by conventional testing. The CGM was seeing something the standard tests missed.
However, this detection capability is only clinically useful if it changes management — if intervention can happen earlier and progression can be prevented. The reassuring news is that lifestyle intervention (exercise, dietary modification, weight reduction) has the strongest evidence base for preventing progression from insulin resistance to pre-diabetes to type 2 diabetes. The Diabetes Prevention Program showed that intensive lifestyle intervention reduced diabetes progression by 58% over 2.8 years. CGM-guided early detection could theoretically increase the window for successful intervention.
The randomized trial evidence for this specific pathway — CGM detection leading to lifestyle change leading to better outcomes in non-diabetics — doesn’t yet exist. But the biological plausibility is strong.
The Consumer CGM Market: What Products Are Available and Who Should Use Them
Until recently, continuous glucose monitors required a prescription, were approved only for diabetes management, and cost hundreds of dollars per month. That’s changed dramatically. The Abbott Lingo and Dexcom Stelo were both cleared by the FDA in 2024 specifically for non-diabetic users without a prescription — the first over-the-counter CGMs approved in the United States.
The Abbott Lingo, essentially a rebranded FreeStyle Libre 3, provides 14 days of continuous glucose readings via a coin-sized sensor worn on the back of the upper arm, connecting to a smartphone app. Retail cost is approximately $49 for a two-pack (28 days of data). The Dexcom Stelo is a 15-day sensor at comparable price points. Neither requires fingerstick calibration. Both are accurate to pharmaceutical grade in the normoglycemic range.
Levels Health and NutriSense provide subscription services that supply CGM sensors (typically Freestyle Libre) with proprietary software apps that add metabolic scoring, food logging integration, coaching, and pattern analysis to raw sensor data. These cost $100-200 per month and are aimed at the health optimization consumer who wants interpretation support alongside the raw data. The value-add of the software layer is genuinely meaningful for non-diabetics who aren’t sure how to contextualize CGM numbers.
Who benefits most from non-diabetic CGM use?
Based on both the evidence and clinical reasoning, the strongest candidates are: people with a strong family history of type 2 diabetes who want early metabolic monitoring; people with prediabetes or impaired fasting glucose who want to make dietary changes but need feedback on whether interventions are working; athletes and high-performance individuals optimizing fueling strategies and recovery; and people with significant abdominal obesity or metabolic syndrome who want objective data to motivate and guide lifestyle change.
The weakest candidates: people with no metabolic risk factors and generally healthy lifestyles who are likely to generate normal data that creates anxiety without providing actionable information; people with existing eating disorders or disordered eating patterns, where real-time glucose feedback can amplify restrictive or anxious eating behaviors; and people who won’t engage in systematic dietary experiments but simply want to monitor numbers without a framework for response.
The Metrics That Matter: Beyond Average Glucose
If you’re going to use CGM data intelligently, you need to move beyond the average glucose number — which is approximately what A1C measures — and understand the full suite of glycemic metrics continuous data provides.
Time in Range (TIR) — the percentage of time spent between 70-140 mg/dL for non-diabetics — is the most clinically validated CGM metric. For healthy individuals, TIR above 90% is a reasonable benchmark. TIR between 80-90% suggests occasional excursions worth investigating. TIR below 80% in a non-diabetic warrants medical evaluation. The specific 70-140 mg/dL range for non-diabetics is tighter than the standard diabetes management TIR of 70-180 mg/dL, reflecting different population norms.
Glucose variability metrics — standard deviation (SD) and coefficient of variation (CV) — capture the amplitude of glucose fluctuations independent of the mean. In non-diabetics, a CV below 20% is generally considered good metabolic flexibility. A CV above 33% — the threshold that indicates hypoglycemia risk in diabetics — would be unusual and concerning in someone without diabetes. SD below 15-18 mg/dL is typical for metabolically healthy adults.
Area under the curve (AUC) above 140 mg/dL is a more detailed metric than peak glucose for assessing meal response. A meal that peaks at 160 mg/dL but returns to 90 mg/dL in 60 minutes has a much smaller AUC than one that peaks at 155 mg/dL but stays elevated for 3 hours. The integrated glucose exposure — not just the peak — determines the duration of oxidative stress and inflammatory signaling.
Apps that calculate AUC above threshold are providing more clinically meaningful data than peak-only displays.
Glycemic excursion frequency — how many times per day glucose rises more than 30 mg/dL above baseline — is an emerging metric from glycemic variability research. Frequent excursions, even when each individual peak is modest, may contribute to cumulative endothelial damage. This is the “many small waves” hypothesis of glucose-mediated vascular injury, as opposed to the “one big spike” model.
The research here is less mature. But it suggests overall glucose stability across the day may be as important as controlling individual post-meal peaks.
Critical Limitations: What CGM Cannot Tell You
A CGM measures glucose. That’s it. The wellness industry narrative around CGM has grown to imply that glucose is a master readout of metabolic health, but this is an overreach that deserves direct pushback.
Insulin levels — arguably more important than glucose for assessing insulin resistance — are not measured by CGM. It’s entirely possible to have perfectly normal glucose readings while hyperinsulinemic (producing excessive insulin to maintain that normal glucose), which is exactly the metabolic state preceding pre-diabetes. A fasting insulin level, HOMA-IR calculation, or triglyceride/HDL ratio tells far more about insulin resistance than a CGM alone. CGM without concurrent insulin awareness is an incomplete metabolic picture.
Inflammatory markers — hsCRP, IL-6, TNF-alpha — drive cardiovascular and metabolic disease independently of glucose. Someone with low glycemic variability but chronically elevated hsCRP and a sedentary lifestyle may be at higher cardiovascular risk than someone with modest glucose spikes who exercises, sleeps well, and has low systemic inflammation. CGM provides one dimension of metabolic health; conflating it with comprehensive metabolic health assessment is a category error.
CGM data doesn’t tell you why glucose is doing what it’s doing. A glucose spike to 170 mg/dL after breakfast could mean too many fast-digesting carbohydrates were eaten, that sleep was poor and cortisol is elevated, that an infection is brewing, that exercise is overdue, or simply that yesterday’s sensor site absorbed more efficiently than today’s does. Interpreting a single data point without context is actively misleading.
The pattern over days and weeks is informative. Individual excursions are noise.
Perhaps most importantly, acting on every glucose fluctuation — immediately restricting foods, adding corrective exercise, adjusting eating patterns in response to sensor readings — can create a relationship with food and body that is objectively more anxious and disordered than whatever it replaced. Medicine has a long history of turning normal physiological variation into pathology through the act of measurement, and CGM in non-diabetics carries this risk. The technology is a tool.
Tools require skilled operators with appropriate frameworks, not anxious users with incomplete context.
Advanced Protocols for Non-Diabetic CGM Use
If you’re going to invest in CGM as a non-diabetic, doing it systematically rather than casually maximizes the signal-to-noise ratio. Here’s an approach based on both the research literature and practical metabolic assessment frameworks.
First two weeks: observational baseline. Don’t change anything. Eat, sleep, exercise exactly as normal. Log meals, sleep quality, and notable stressors. Review the data at the end without judgment. Identify personal glucose response patterns — which meals cause the largest excursions, what time of day glucose runs highest, whether the expected morning cortisol rise shows up, how exercise affects the numbers. This baseline is a metabolic fingerprint.
Second CGM session (weeks 3-4): controlled experiments. Test specific hypotheses generated from the baseline. If oatmeal spiked, try oatmeal with added fat and protein and see if the spike attenuates. If lunch spikes are consistently high, test a 15-minute walk after lunch. If morning glucose is elevated, investigate sleep quality and the previous evening’s food. This is the evidence-based iteration that transforms the technology from data collection to behavioral optimization.
Use CGM intermittently, not continuously. Wearing a CGM indefinitely has diminishing returns and potentially increasing psychological costs. A 2-week session twice per year — once after a period of baseline eating and once during an intervention — provides actionable comparative data without creating chronic glucose vigilance. This intermittent use model is likely to generate more benefit and less harm than continuous year-round monitoring.
Get concurrent labs during any CGM session. Fasting insulin, HOMA-IR, lipid panel with triglycerides and HDL, hsCRP, and fasting glucose give the CGM data clinical context. A CGM showing modest post-meal excursions alongside a fasting insulin of 15+ uIU/mL (hyperinsulinemic) reveals important metabolic information that the CGM alone couldn’t provide. Good glycemic control on the CGM and clean labs together — that’s genuinely reassuring comprehensive metabolic health data.
CGM Actually Measures: Your Questions Answered
Is it normal for non-diabetics to go over 140 mg/dL on a CGM?
Yes, brief excursions above 140 mg/dL are normal in metabolically healthy people after certain meals. Population CGM studies consistently show that healthy individuals exceed 140 mg/dL transiently after high-carbohydrate meals. What matters is duration and frequency — brief excursions that return to baseline within 60-90 minutes are physiologically normal. Persistent elevation above 140 mg/dL for more than 2 hours after a meal, or frequent daily excursions above 160-170 mg/dL, warrants a conversation with a physician.
The clinical diagnostic threshold of 140 mg/dL at 2 hours post-meal (from an oral glucose tolerance test) is a different measurement from a brief CGM spike and shouldn’t be directly compared.
Can a CGM help with weight loss?
Potentially, through the mechanism of behavioral feedback rather than any metabolic magic. Studies in non-diabetics using CGM for weight management show that the real-time feedback helps people identify specific high-glucose foods and eating patterns, increases adherence to dietary interventions, and motivates lifestyle behaviors (walking after meals, improving sleep) that have independent metabolic benefits.
However, a 2023 randomized controlled trial in JAMA Internal Medicine found no significant difference in weight loss between overweight adults using CGM versus standard dietary advice over 6 months — suggesting the technology alone doesn’t drive weight reduction without a behavioral intervention framework.
Do I need a prescription for a CGM?
As of 2024, no — the Abbott Lingo and Dexcom Stelo are FDA-cleared over-the-counter CGM devices in the United States, purchasable directly without a prescription. However, insurance coverage (if desired) typically still requires a prescription and diabetes diagnosis. Traditional CGM devices like the Dexcom G7 or FreeStyle Libre 3 still require a prescription for covered use. The OTC options are not covered by insurance but are competitively priced at approximately $49-89 per sensor.
Can CGM detect pre-diabetes before standard tests?
CGM metrics can identify patterns suggestive of early insulin resistance before standard tests (fasting glucose, A1C) become abnormal. The evidence base reveals that CGM-derived metrics — time above 140 mg/dL, glycemic variability, post-meal AUC — predict progression to pre-diabetes over 3-5 year follow-up in individuals who are “normal” on standard testing. However, CGM is not a validated clinical tool for diagnosing pre-diabetes.
If a CGM shows persistent concerning patterns, the appropriate next step is a formal oral glucose tolerance test (OGTT) with simultaneous insulin levels — not self-diagnosis based on CGM data alone.
How much does non-diabetic CGM use cost, and is it worth it?
OTC sensors (Lingo, Stelo) cost approximately $49-89 per 14-15 day sensor. A two-session annual protocol (28-30 days total) costs approximately $100-180 for sensors, plus optional app subscriptions for Levels or NutriSense at $99-199 per month. Total annual cost for a systematic two-session protocol: approximately $200-550. Whether this is “worth it” depends entirely on what happens with the data.
For someone with metabolic risk factors, family history of diabetes, or who needs objective feedback to motivate dietary changes, the investment is reasonable. For someone who’ll passively watch numbers without systematic behavioral response, it’s probably unnecessary spending that may generate anxiety without benefit.
What should I do if my CGM shows consistently high glucose?
Define “consistently high” precisely before panicking. Persistent fasting glucose above 100 mg/dL, time in range below 85%, or frequent post-meal excursions above 160 mg/dL for more than 2 hours are patterns worth discussing with a physician — not because the CGM diagnoses diabetes, but because they suggest a formal evaluation (fasting glucose, A1C, fasting insulin, OGTT) is warranted. Don’t attempt to self-diagnose or self-manage based on CGM data alone.
The CGM identifies a signal. Clinical evaluation identifies the cause and appropriate response.
The Practical Framework: Applying CGM Actually Measures Doesnt In Real Life
References