
Take a guy we’ll call James, wearing a continuous glucose monitor to a dinner party, explaining the small white sensor on his upper arm to every single person who clocked it. “Are you diabetic?” Universal first question. “No,” he’d say, “just curious.” That answer landed somewhere between baffling and suspicious for most of the table. What kind of healthy person tracks their blood sugar around the clock?
The answer, increasingly, is: anyone who wants to know what’s actually happening inside their body instead of guessing from annual blood tests that catch a single moment in a year of continuous metabolic churn. The HbA1c a doctor measures at the annual physical is a three-month average. Fasting glucose is a snapshot taken after an overnight fast under artificially controlled conditions. Neither one tells you what blood sugar does after Tuesday’s lunch, or during the 3pm slump, or why sleep goes sideways on pasta nights.
A continuous glucose monitor answers all of that and more. The device — a small sensor inserted just beneath the skin of the upper arm or abdomen — measures glucose in interstitial fluid every few minutes and sends the readings to a phone app. What comes back is a continuous trace of glucose levels across the day, visible in real time, with the ability to go back and match spikes and dips to specific foods, activities, stress events, sleep quality.
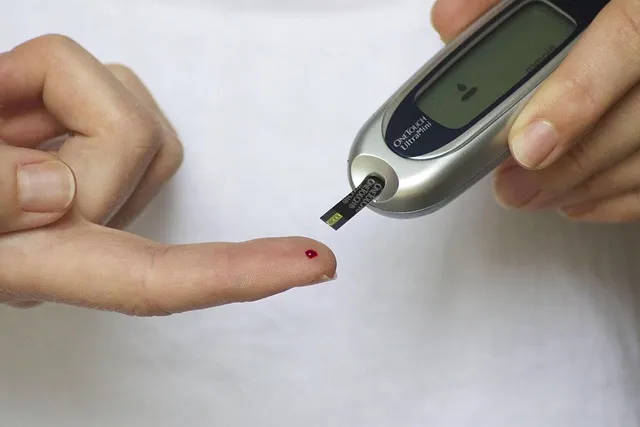
This guide walks through what the patterns mean, what’s normal versus concerning, and how to read CGM data in a way that produces actual changes — not just a fresh source of anxiety about numbers.
How a CGM Works: The Technology Explained
Most commercial CGMs run on an electrochemical glucose oxidase sensor — a tiny needle-like probe sitting in subcutaneous tissue, measuring glucose concentration in interstitial fluid (the fluid surrounding cells) rather than directly in blood. That distinction matters: interstitial glucose lags blood glucose by roughly 5-15 minutes, so CGM readings during rapid glucose change — a fast-rising spike, a sharp exercise-driven drop — can differ from a simultaneous finger-stick by 15-20 mg/dL or more.
Consumer CGMs aimed at non-diabetics currently include Levels (Dexcom sensor), Nutrisense (Abbott Libre sensor), and Signos (also Abbott Libre). All three give two weeks of sensor use, phone connectivity, and app-based interpretation. Dexcom and Abbott also make CGMs for diabetic use (Dexcom G7, FreeStyle Libre 3) that require prescriptions but sometimes get used off-label by non-diabetics working with functional medicine physicians or endocrinologists.
The sensors run continuously for the life of the sensor (7-14 days depending on product) and can be worn through exercise, showers, sleep — the exact activities where glucose patterns tend to be most revealing. Most people forget they’re wearing one after the first day.
Accuracy has improved a lot with each generation. Current sensors land within roughly 10-15% of blood glucose values for most readings, with somewhat more error at the extremes — very low or very high values. For the non-diabetic population, where glucose mostly stays in a range well within sensor accuracy, those errors matter less than they would for a diabetic adjusting insulin doses off the same readings.
The Hall 2018 Study: Why Glucose Responses Are Personal
The 2018 study by Kevin Hall and colleagues at the National Institutes of Health used CGM in a controlled inpatient setting to look at how different foods and meal patterns move glucose in non-diabetic subjects. The 2015 Zeevi study had already established individual variation in CGM responses under free-living conditions; Hall’s work took a more controlled look at specific dietary patterns and their metabolic effects.
One key finding: people eating identical foods show substantially different glucose responses depending on baseline metabolic health, gut microbiome composition, and individual insulin secretion characteristics. Even in a metabolically homogenous group of healthy non-diabetic subjects, glucose responses to the same standardized meal spanned 40-60 mg/dL from lowest responder to highest.
That finding has real implications for how dietary advice should work. Population-based glycemic index recommendations assume a food’s glycemic effect is fixed and universal. CGM data shows it isn’t — the same food runs high-glycemic for one person and low-glycemic for another, which makes individualized monitoring worth more than any static glycemic index chart.
Hall’s research also flagged the role of prior exercise and sleep quality in shaping glucose responses to the next meal — consistent with the mechanistic research, but now visible in real-world CGM data. Subjects who’d exercised the day before consistently posted lower postprandial responses than on sedentary days; subjects who’d slept badly posted consistently higher ones.
What Good CGM Patterns Look Like
Before getting into concerning patterns, it’s worth establishing what normal, healthy glucose looks like on a CGM trace — a reference point most first-time users simply don’t have.
Fasting baseline glucose in a metabolically healthy person typically sits between 72-90 mg/dL overnight and in the early morning. That range reflects the pancreas holding blood sugar steady through a balance of hepatic glucose production and baseline insulin secretion during the fasted state.
After meals, postprandial glucose rises, peaks within 30-90 minutes, and returns to within 20-30 mg/dL of baseline within 2-3 hours. Peak values below 120-130 mg/dL are generally considered optimal. Values consistently under 140 mg/dL fall within “normal” by conventional medical standards, though a growing body of evidence suggests chronic excursions above 120 mg/dL track with accelerated metabolic aging even under the clinical threshold for concern.
Variability matters as much as any single number. A healthy trace has smooth curves — gradual rises, gradual returns, a fairly limited range of motion (rarely more than a 60-80 mg/dL swing from nadir to peak), and a consistent overnight baseline. A problematic trace shows sharp, high peaks with slow returns, real variability throughout the day, and an elevated overnight baseline that never fully settles back into the 72-90 mg/dL range.
Time in range (TIR) is a summary metric borrowed from diabetes management that applies just as well to non-diabetic optimization. TIR measures the percentage of CGM readings inside a target range (typically 70-140 mg/dL for diabetic standards, or 70-120 mg/dL for non-diabetic goals). A metabolically healthy person should sit in range above 90% of the time — under 10% of the day spent above 120-140 mg/dL, and essentially no time below 70 mg/dL.
Reactive Hypoglycemia: When Glucose Crashes After Spiking
Reactive hypoglycemia is one of the most consistently surprising findings for people who first use CGMs. It’s the pattern where blood glucose spikes after a high-glycemic meal, then crashes below normal fasting levels — often to 65-70 mg/dL or lower — because the insulin response overshoots the glucose clearance target.
The crash produces symptoms most people have felt and never connected to a blood sugar event: afternoon fatigue, irritability, intense hunger two to three hours after a meal that felt substantial, trouble concentrating, shakiness, cravings for sweet or starchy foods. These are the body’s alarm bells going off because blood sugar dropped too low — and the instinctive response is to eat more, immediately, which restarts the spike-crash cycle.
Reactive hypoglycemia shows up most often after high-glycemic meals — big bowls of cereal, sweetened beverages, large portions of white rice or pasta — that trigger sharp insulin responses. It’s a hallmark of insulin resistance or early metabolic dysfunction, where the insulin response to glucose runs dysregulated: too large, poorly timed relative to the glucose rise, or both. People who eat breakfast and are ravenous two hours later despite a big meal are frequently living this pattern without knowing its name.
CGM makes it visible instantly — glucose spikes to 175, crashes to 68, and the symptoms arrive right at the trough, on schedule. Once someone’s seen that in their own data, the motivation to change behavior runs a lot deeper than any abstract health advice could produce. You’re watching yourself trigger the cycle in real time, and from there it becomes possible to make targeted changes to interrupt it.
The Dawn Phenomenon: Morning Glucose Elevations
Plenty of CGM users are puzzled to discover blood sugar rising in the early morning hours (typically 4am to 8am) with no food involved. Go to bed at 90 mg/dL, sleep through the night, wake up at 110-120 mg/dL before eating a thing. This is the dawn phenomenon, and understanding it is what separates normal physiology from a genuinely concerning pattern.
The dawn phenomenon happens because cortisol and growth hormone both rise in the early morning as part of normal circadian rhythm — the body gearing up for the day’s activity. Those hormones push the liver to release glucose into the bloodstream (hepatic glucose production) to fuel the awakening body. In metabolically healthy people, insulin handles this release efficiently and the rise stays modest — 10-20 mg/dL above overnight baseline. In insulin-resistant people, the phenomenon runs stronger, because the liver dumps more glucose and the insulin response is less efficient, sometimes producing a morning baseline of 120-140 mg/dL before any food shows up.
This is why fasting glucose — even after 8-12 hours without food — doesn’t actually reflect the body’s true “empty” state. The liver’s been busy the whole early morning producing glucose, and the 7am reading captures that activity, not some quiescent overnight metabolism. In severe insulin resistance, the dawn phenomenon contributes substantially to elevated HbA1c even when postprandial glucose is being managed reasonably well.
For CGM users, distinguishing the dawn phenomenon from sleep-disruption-related elevations is genuinely useful: the dawn phenomenon follows a predictable circadian pattern (rises every morning, pre-dawn), while stress-related overnight elevations are more variable and line up with known stress events. Both show up on the CGM; telling them apart just requires looking at patterns across several days rather than one night’s reading.
Exercise Patterns on CGM Data
Exercise produces some of the most visually dramatic patterns on a CGM trace, and they’re often counterintuitive until the physiology clicks.
Aerobic exercise (running, cycling, rowing) at moderate intensity usually causes a gradual, progressive drop in blood glucose during the session — muscle glucose uptake through GLUT4 activation outpaces hepatic glucose production, and glucose falls. The post-exercise period shows elevated insulin sensitivity for 12-24 hours, visible as a lower-than-baseline fasting glucose the morning after an evening workout.
Resistance training produces a messier pattern. The start of a hard resistance session often shows a transient glucose rise of 20-40 mg/dL as catecholamines and cortisol mobilize glucose for fuel before muscular uptake catches up. During the session glucose typically stabilizes and may start to fall. After the session it returns to baseline or below, and post-exercise insulin sensitivity stays elevated for 24-48 hours in the trained muscle groups.
High-intensity interval training can produce more dramatic elevations mid-session — anaerobic work leans heavily on glucose, and the stress hormone surge from maximum effort mobilizes substantial hepatic glucose release. A 20-30 mg/dL spike mid-HIIT session is normal, not concerning; it reflects the energy demands of intense anaerobic work, and the glucose clearance and insulin sensitization that follow are genuinely beneficial.
CGM data makes it possible to see which exercise modalities move your glucose most favorably, which times of day work best for glucose management, and whether post-exercise recovery nutrition actually fits your metabolic response. This is performance optimization data that simply didn’t exist for non-diabetic athletes before consumer CGMs came along.
Stress and Glucose: The Pattern Nobody Talks About
One of the more revelatory experiences for CGM users is watching blood sugar climb during a stressful event with zero food involved. James watched his glucose climb from 88 to 114 during a particularly tense conference call. No food. No exercise. Just a difficult conversation and the cortisol and adrenaline that came with it.
Psychological stress fires up the sympathetic nervous system, which releases adrenaline and pushes the adrenal glands to secrete cortisol. Both hormones stimulate hepatic glucose production and reduce insulin sensitivity in peripheral tissues — the body’s ancient prep for fight or flight, which needed rapidly available blood glucose for muscle fuel. In the modern context, where psychological stress rarely ends in physical activity, all that mobilized glucose has nowhere useful to go and just sits there elevating blood sugar for the duration of the stress response.
The pattern shows up on CGM as unexplained glucose elevations during the day, unconnected to food. Once that pattern’s been spotted in someone’s own data — glucose reliably climbing during the worst work hours, or before a hard conversation, or during a scroll through the news — the case for stress management stops being abstract and starts feeling visceral. Chronic stress is actively damaging metabolic health, in real time, on the screen.
This might be the most underappreciated value of CGM for non-diabetic users: it makes the metabolic consequences of lifestyle factors — not just food — visible and concrete. Sleep deprivation shows up in tomorrow morning’s glucose. Chronic stress shows up in the afternoon peaks. Exercise shows up in the overnight baseline. The CGM is a holistic metabolic mirror, not just a food diary.
The CGM Interpretation Guide Framework
Interpreting CGM data productively means moving past individual readings and into pattern recognition. The following six-step protocol applies to any two-week CGM trial.
Step 1: Establish your fasting baseline. Look at overnight glucose (midnight to 6am) on nights of good sleep, no food within three hours of bed. The typical overnight range is a rough read on baseline metabolic health. Below 85 mg/dL: excellent. 85-95 mg/dL: good. 95-105 mg/dL: worth watching closely, possible early insulin resistance. Above 105 mg/dL fasting: worth a conversation with a physician, possible prediabetes.
Step 2: Catalog your postprandial peaks. For each meal, note the peak value and the time from eating to peak. Normal timing is 30-60 minutes to peak; a prolonged peak at 90-120 minutes suggests altered gastric emptying. Peak values: below 120 mg/dL (optimal), 120-140 mg/dL (acceptable), 140-160 mg/dL (concerning), above 160 mg/dL (worth investigating and adjusting the diet).
Step 3: Assess your return-to-baseline time. After a peak, how long until glucose gets back within 20 mg/dL of fasting baseline? Under 2 hours is good. 2-3 hours is acceptable. Consistently above 3 hours suggests impaired glucose clearance — insulin resistance, or not enough muscle mass for glucose disposal. Worth noting whether post-meal walks visibly speed up the return (they should).
Step 4: Look for reactive hypoglycemia patterns. Does glucose ever drop below 70 mg/dL after a postprandial spike? Does it drop below overnight baseline at any point in the day? Reactive hypoglycemia after a spike signals insulin dysregulation and points straight back at whichever meal caused the preceding spike.
Step 5: Correlate patterns with lifestyle variables. Compare glucose on high-sleep nights versus poor-sleep nights. Compare exercise days versus rest days. Note whether stress events produce elevations. These correlations surface the non-dietary variables shaping glucose management — often as significant as the dietary ones.
Step 6: Calculate your time in range. Total the percentage of readings between 70-120 mg/dL. Above 90%: excellent metabolic control. 80-90%: good but improvable. Below 80%: a meaningful chunk of the day spent outside optimal range, worth addressing systematically. This one summary statistic makes it possible to compare before and after any specific intervention.
Continuous Glucose Monitor: Your Questions Answered
- Do I need a doctor’s prescription to use a CGM? Consumer services like Levels, Nutrisense, and Signos run subscription models that don’t require a personal prescription — they use affiliated physicians who authorize sensor use through a telehealth framework. The sensors (Abbott Libre, Dexcom) are FDA-cleared medical devices, but these services have opened them up to non-diabetics through their prescribing network. Direct Dexcom and Abbott sensors require prescriptions through a personal physician, or through telehealth platforms.
- How accurate are consumer CGMs compared to finger-stick testing? Current-generation CGMs (FreeStyle Libre 3, Dexcom G7) run mean absolute relative differences (MARD) of roughly 7-10% against blood glucose meter measurements. A reading of 100 mg/dL, in practice, might correspond to a true blood glucose of 92-108 mg/dL. For pattern recognition — which is how non-diabetics mostly use the data — that’s excellent accuracy. For precise medical decisions (insulin dosing, treating hypoglycemia), finger-stick confirmation is still the move.
- What should I do with my CGM data if I see concerning patterns? Document patterns consistently across the full two-week trial before drawing conclusions — a single day can get thrown off by an unusual event. Consistent fasting glucose above 100 mg/dL, postprandial peaks above 160 mg/dL, or reactive hypoglycemia — bring that data to a physician. It’s significantly more information than standard testing provides and may reshape how a physician evaluates metabolic health. Don’t self-diagnose or self-treat off CGM data alone — use it to start a conversation with a clinician.
- Is a CGM useful for someone who is already metabolically healthy? Yes, for different reasons than for someone with metabolic dysfunction. For a healthy person, CGM produces personalized food-response data that supports targeted dietary optimization rather than generic population-average advice. It flags specific problematic meals, validates protective behaviors (exercise, sleep, food order), and gives a baseline for comparing future metabolic changes. The educational value of understanding individual glucose responses is real even when every number is already in healthy range.
- Why does my glucose sometimes rise during fasting without eating anything? This is typically either the dawn phenomenon (early-morning cortisol-driven hepatic glucose release, covered above) or the liver continuing to release glucose during a prolonged fast (gluconeogenesis). During extended fasts (16+ hours), the liver produces glucose from amino acids and glycerol to hold blood sugar steady, which can cause modest rises even without food. That’s normal physiology. Glucose consistently climbing above 110 mg/dL during fasting, with no food involved, is worth investigating as a sign of impaired hepatic insulin signaling.
- Can CGM data help with weight management? Some evidence suggests personalized dietary guidance based on CGM data supports better weight and metabolic outcomes than standard dietary advice. The theory: eating in ways that keep glucose stable — avoiding big spikes and crashes — reduces appetite variability, prevents the reactive-hypoglycemia-driven overeating cycle, and supports fat-burning during periods of low glucose. Whether CGM-guided eating beats other structured dietary approaches in controlled trials is still being worked out, but the mechanistic rationale holds up, and plenty of users report better appetite regulation with CGM-guided adjustments.
- How often should I use a CGM? A two-week trial gives a comprehensive baseline and enough data for meaningful pattern recognition. Annual or biannual two-week trials track how glucose patterns shift over time and how effective lifestyle changes have actually been. Some people run quarterly monitoring during dietary experiments or particularly high-stress stretches of life. Continuous year-round monitoring matters most for people with prediabetes or established metabolic dysfunction who need ongoing feedback to guide management.
- Does alcohol affect blood sugar on CGM? Yes, in a complicated way. Initial alcohol consumption can cause a modest glucose rise from the carbohydrate content of the drink (beer, wine, mixed drinks). But alcohol also inhibits hepatic gluconeogenesis — the liver’s ability to make glucose — which can cause a substantial drop hours later, particularly overnight. People who drink and then notice overnight hypoglycemia (below 70 mg/dL in the early morning) on CGM are watching alcohol suppress hepatic glucose production right when the dawn phenomenon would normally be raising glucose. A carb-containing snack before bed, on drinking nights, can head this off.
James wore three CGM sensors over two months. The first was pure discovery — the dinner party incident, the revelation about his Tuesday lunch salad (unremarkable glucose), the afternoon coffee with a muffin that spiked him to 171 and crashed him to 63 ninety minutes later. The second was an experiment — systematic food order changes, post-meal walks, ACV before high-carb dinners. His time in range went from 68% to 87% in two weeks. The third was confirmation — the new patterns held, his reactive hypoglycemia had almost disappeared, and he’d stopped needing his 3pm coffee to overcome the afternoon energy crash that had defined his workdays for years. The crash was gone because the spike was gone. It had never been about willpower. It had always been about glucose.
The continuous glucose monitor is about the most informative metabolic tool available to non-diabetic people right now. It turns abstract nutritional principles into concrete, personal, real-time feedback. It turns “eat less sugar” into “here’s exactly what that specific food did to your blood sugar, here’s the crash that followed, and here’s the finding that matters: a ten-minute walk afterward would have prevented it.”
The information changes how a person thinks about food, exercise, sleep, stress — not through guilt or restriction, but through understanding. Once what’s actually happening in the body is understood, the right decisions stop feeling forced and start feeling obvious. That’s the real value of the data: not the numbers themselves, but the clarity they produce.
CGM for Athletic Performance Optimization
Beyond metabolic health management, athletes and serious exercisers are finding that CGM data delivers insight no standard sports nutrition protocol can offer — because those protocols are built on population averages, and individual responses are exactly that: individual.
Pre-workout glucose affects performance. Starting an intense session below 80 mg/dL is linked to faster fatigue, reduced power output, and impaired high-intensity performance in most people. CGM data means knowing actual pre-workout glucose instead of guessing at it — and timing nutrition accordingly. Some athletes find a small carb snack 30-45 minutes pre-training moves them into the 90-110 mg/dL range that supports peak performance; others find training in a mild fasted state (80-90 mg/dL) is their preferred performance zone. Only the data says which camp anyone falls into.
Intra-workout glucose varies enormously by modality, intensity, duration, individual metabolic rate. Endurance athletes on long aerobic sessions can watch glucose decline progressively and calibrate carb supplementation to hold their optimal performance range, instead of leaning on the generic “take a gel every 45 minutes” advice. For one athlete that protocol keeps glucose steady. For another it produces spikes that impair fat oxidation without meaningfully improving performance.
Post-workout recovery nutrition benefits from CGM guidance too. The post-exercise glucose curve shows whether a recovery meal is timed right — preventing the post-workout reactive hypoglycemia that impairs recovery and drives muscle catabolism in some athletes, while avoiding the excessive glucose response that blunts the post-exercise insulin sensitivity benefit that makes that meal matter for muscle protein synthesis and glycogen replenishment in the first place.
Elite athletes increasingly treat CGM as a standard training tool — not to treat diabetes, but to optimize fuel use, recovery, adaptation. It democratizes access to information that used to require expensive lab testing or years of trial and error. Competitive athlete or weekend warrior, CGM data is performance intelligence no static nutrition protocol can match.
Practical Setup: Getting the Most From Your First CGM Trial
A CGM sensor runs roughly $50-100 for two weeks, plus platform fees for consumer services like Levels or Nutrisense that layer on app-based interpretation. Getting real value from that spend takes deliberate setup and systematic data habits during the trial.
Before applying the first sensor, set up a log for the trial period. Track every meal (what, when, roughly how much), every exercise session (type, duration, intensity), sleep timing and quality, and notable stress events. Most consumer CGM apps have meal logging built in, but they can only correlate data with what’s actually logged — miss a meal log and the context for a glucose pattern goes missing with it.
In the first few days, before changing anything, just observe the baseline on a normal diet and normal habits. This baseline is the comparison point for everything that follows. Change the diet on day one and there’s no true baseline — just data from a modified version of normal behavior. Resist the urge to optimize immediately. Watch first. Change later.
After baseline, experiment systematically, one variable at a time. Try the food-order change (vegetables and protein first) for three days and watch what happens to postprandial peaks. Add post-meal walks for three days and observe. Test the same meal with and without apple cider vinegar on alternating days. One variable at a time produces data that’s actually interpretable. Multiple simultaneous changes produce a mess — something changed, sure, but no way to say what.
At the end of the trial, calculate time in range before and after the interventions, identify the three worst meals (highest peaks, slowest return to baseline), and identify the three most effective interventions (biggest reductions in peak glucose or area under the curve). Six data points — three problems, three solutions — and that’s a personalized metabolic action plan no generic dietary advice can replicate.
Limitations of CGM Data: What It Can and Cannot Tell You
CGM is a powerful tool that generates genuinely useful metabolic information, but like any tool, it has limits that shape how its data should be read and acted on.
CGM measures glucose only — not ketones, not lactate, not insulin, none of the other metabolic variables that together paint the full picture of metabolic health. A glucose reading of 90 mg/dL says blood sugar is in normal range but says nothing about whether the insulin required to get there was 5 uIU/mL (healthy) or 25 uIU/mL (severely insulin resistant). Two people can post identical CGM traces with dramatically different underlying insulin levels and insulin resistance severity. CGM data gets its full meaning when paired with fasting insulin, HbA1c, and lipid panel data — not standing alone as a complete metabolic picture.
The 5-15 minute lag between blood glucose and interstitial glucose creates specific interpretation errors during rapid glucose change. During exercise, blood glucose can be falling fast while the CGM still reads several minutes behind. During the initial absorption phase of a meal, blood glucose rises before interstitial glucose catches up. The lag slightly misrepresents the timing of peaks and troughs — which matters less for overall pattern recognition and more for precise moment-to-moment decisions.
Sensor placement and technique affect accuracy. Sensors on areas with more subcutaneous fat can read differently than sensors on leaner areas. Compression during sleep (lying on the sensor arm) can produce falsely low readings. Heat from a hot shower can throw off a transient artificial reading. Learning to spot artifacts in the data — the unexpected values that don’t correlate with anything eaten or done — is part of developing fluency with the device.
Finally, the psychological impact of continuous monitoring deserves acknowledgment. Some people find constant access to glucose data produces health anxiety, dietary rigidity, an obsessive relationship with the numbers that erodes quality of life even while the metabolic metrics improve. Anxious about every meal, or eating differently out of fear of a spike rather than genuine health motivation — that’s the monitoring doing more psychological harm than metabolic good. CGM is a tool for information, not a pass/fail system for every meal. Use it to learn. Not to score yourself.
The two-week limited trial format addresses this directly: get the information, update the patterns based on it, then put the monitor away and live life with the knowledge gained rather than the perpetual anxiety of constant monitoring. For most non-diabetic users, that’s the right use case — data-informed freedom, not data-dependent management.
James, at his next dinner party, explained the CGM to the curious guests with a lot more confidence. Not “I’m just curious.” Instead: “I learned that my Tuesday afternoon energy crash is caused by a blood sugar spike from my lunch, and I fixed it by changing the order in which I eat my meals.” That’s a conversation worth having. That’s what the data is for.
The Future of CGM: Where the Technology Is Heading
Consumer CGM for non-diabetics is still in its early commercial phase, and the near-term trajectory points toward greater accessibility, lower cost, and expanded measurement.
Implantable long-duration sensors (90-day and beyond) are in development, which would slash the cost-per-day of monitoring and make continuous long-term tracking practical for a much broader population. Wearable optical CGM — glucose monitoring through the skin, no needle — is an active research area that, if it clears the accuracy bar, could push continuous metabolic monitoring even further into the mainstream.
Multi-analyte sensors measuring glucose alongside ketones, lactate, cortisol, or other metabolic markers are in various stages of development and early commercial rollout. A sensor showing glucose and cortisol together would make the stress-glucose relationship visible at a level of detail current single-analyte CGM can only approximate indirectly. Glucose-plus-ketone monitoring would be particularly valuable for people on ketogenic approaches, where the glucose-ketone inverse relationship is the primary metabolic target.
Integration of CGM data with AI-based dietary and behavioral guidance — already underway at Levels, Nutrisense, and similar platforms — will keep improving as more users generate more data and the recommendation algorithms get more sophisticated. The promise is a system that learns individual metabolic responses well enough to give genuinely personalized nutritional guidance rather than population-average advice. Whether that promise fully lands depends on data quality, algorithmic sophistication, and whether the metabolic variance between people is ultimately learnable from CGM data alone or needs additional biomarker inputs.
What’s clear is that the era of inferring metabolic health from a once-a-year blood test is ending. The tools for continuous metabolic insight are here, accessible, increasingly affordable. The only question left is whether anyone will use them to understand their own biology before it starts demanding attention in far less convenient ways.
References
Editorial StandardsCorrectionsMedical DisclaimerAbout Our ContentAffiliate DisclosureSite Map