
Sofia had been training for a half-Ironman for two years — twelve hours a week logged, and her run split plateaued at every single race regardless. Her coach was stumped. Training was solid. Nutrition was dialed in. Swim and bike had both improved steadily across that stretch. Running just wasn’t moving. Then she pulled her training data and actually looked at the intensity distribution. Of those twelve weekly hours, eleven sat in what her GPS watch called Zone 3 — moderate intensity, neither easy nor hard, which physiologically is close to running in place as far as aerobic development goes. She’d been spending every session in what exercise scientists sometimes call the black hole: too hard for aerobic development, too easy for anything meaningful in the high-intensity direction.
Sofia didn’t have a training problem. She had a heart rate zone problem — specifically, she’d misunderstood what the zones actually mean, ignored the one that matters most (Zone 2), overused the one that matters least (Zone 3), and trained almost entirely by feel in a range that generated fatigue without corresponding fitness gains. Two months of deliberately restructured training with a proper intensity distribution changed her run split by four minutes at the very next race.
Heart rate training zones are probably the most widely misunderstood framework in endurance sports. Everyone’s heard of them. Most people own a GPS watch that displays them front and center. Few people understand what they actually represent physiologically, how to calculate them accurately, how to apply them with any intelligence, or why the conventional approach — evenly spread moderate-intensity training — might be close to the least efficient possible use of training time.
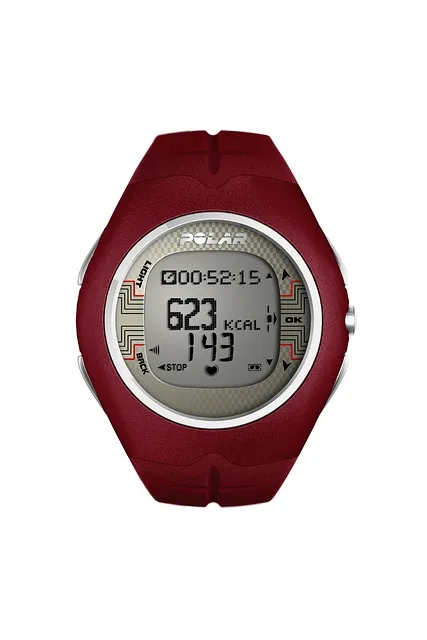
What Heart Rate Zones Actually Represent: The Physiology
Heart rate zones are a proxy for metabolic intensity — specifically, which energy systems are dominant at any given moment and in what proportion. Understanding what’s actually happening physiologically at each zone turns them from arbitrary numbers on a screen into meaningful information about how the body is working.
Heart rate tracks workload because the cardiovascular system responds to the metabolic demands of working muscle. As intensity climbs, muscles need more oxygen and produce more CO2, which requires more cardiac output — heart rate times stroke volume. Heart rate rises with effort as a result, which makes it a practical real-time proxy for metabolic load. Imperfect, but accessible without lab equipment.
Two physiological thresholds anchor the whole zone framework. The first ventilatory threshold (VT1), often called the aerobic threshold, marks the point where lactate starts accumulating above resting levels — roughly the shift from pure aerobic metabolism toward increasing anaerobic glycolytic contribution. Below VT1, fat oxidation dominates and minimal lactate builds up. Above it, lactate-buffering demand climbs progressively. VT1 lines up with the point where conversation becomes effortful — full sentences still possible, but not comfortably, not for long stretches.
The second ventilatory threshold (VT2) — the lactate or anaerobic threshold — marks where lactate accumulation outpaces buffering capacity, the highest sustainable intensity before the lactate curve goes exponential and performance craters. Above VT2, maybe a word or two at a time is possible; clearly high-intensity, unsustainable past 10-60 minutes depending on training status. This threshold roughly maps to race pace for 30-60 minute events — 10K to half-marathon pace, for runners.
The five-zone model maps intensities against those two thresholds:
Zone 1 (Recovery/Easy): Below roughly 65% of max heart rate. Genuinely easy, well below VT1. Fat oxidation dominant. Sustainable for close to forever. Conversation is effortless. Active recovery, warm-up, cooldown territory.
Zone 2 (Aerobic Base): Roughly 65-80% of max. At or below VT1. The highest intensity that still feels sustainable for hours while staying primarily aerobic. Fat oxidation is high, with some carbohydrate use. This is the zone that builds the aerobic base — mitochondrial density, fat oxidation capacity, capillary development, cardiac efficiency. The single most important zone for long-term endurance.
Zone 3 (Tempo): Roughly 80-88% of max. Between VT1 and VT2. Moderate-to-hard. Some aerobic benefit, but significant glycolytic contribution alongside it. Generates real fatigue relative to the aerobic adaptation it produces. Research consistently flags this zone as the least efficient use of training time — fatigue without Zone 2’s aerobic base stimulus, and without Zones 4-5’s high-intensity adaptations either.
Zone 4 (Threshold): Roughly 88-95% of max. At or near VT2. Hard — sustainable for 20-60 minutes. Improves lactate threshold, meaning the ability to hold higher intensities before lactate piles up fast. Highly taxing, demands real recovery.
Zone 5 (VO2 Max): Above 95% of max. Maximum or near-maximum effort. Targets VO2 max, the top rate of oxygen utilization. Sustainable for only 2-8 minutes per interval. The single most powerful stimulus for cardiovascular adaptation in short bursts, but completely unsustainable at high total volume given the recovery demands and fatigue it stacks up.
Why 220-Age Is Wrong: The MaxHR Calculation Problem
The 220-age formula for estimating max heart rate is everywhere — the default on nearly every consumer GPS watch, every gym cardio machine, every popular health app. It’s also demonstrably inaccurate for individual prediction, carrying a standard deviation of roughly 10-12 beats per minute across most populations. For a 40-year-old with a predicted max of 180 bpm (220 minus 40), actual max could land anywhere from 158-202 bpm — a spread wide enough to make the prediction more or less useless for accurate zone calculation.
The formula’s origin is itself shaky. It came from a 1971 paper by Fox and Haskell synthesizing prior data, and as David Bassett and Timothy Church pointed out in a 2005 review, the original formula was never validated prospectively, rested on small samples, and was never intended as a universal predictive equation. It became conventional wisdom purely through repetition, not evidence.
The inaccuracy has real practical consequences. Take a 40-year-old whose actual max HR is 190, not 180. Setting a Zone 2 ceiling at 80% of predicted max — 144 bpm — actually puts them at 75.8% of true max, potentially below the intensity needed for meaningful aerobic adaptation. Flip it: true max of 170, and the same calculation puts them at 84.7% of true max — deep into Zone 3 “black hole” territory while they believe they’re doing Zone 2 work.
The Karvonen formula — using heart rate reserve, max HR minus resting HR, instead of an absolute number — gives somewhat better individual calibration and is generally preferred for zone calculation. The formula: Target HR = Resting HR + ((Max HR − Resting HR) × Intensity fraction). A 40-year-old with resting HR of 55 and true max of 185, targeting 70% intensity: Target HR = 55 + ((185−55) × 0.70) = 55 + 91 = 146 bpm. This accounts for individual resting HR variation — itself a marker of cardiovascular fitness — and produces a more accurate individual zone calculation.
The most accurate approach, though, is field testing. For runners: a 30-minute maximum-sustainable-effort time trial with a heart rate monitor, taking the average HR of the final 20 minutes as an approximation of lactate threshold HR. For a more direct max HR reading: a 400m or 800m maximum-effort interval at the end of a properly warmed-up session, watching for peak HR. Laboratory testing — a graded exercise test with lactate or ventilatory threshold measurement — is the gold standard for precise values, though rarely accessible outside elite sport.
The Science of Polarized Training: Seiler’s Research
The most evidence-supported approach to zone distribution for endurance development is polarized training, a model developed and refined by Stephen Seiler and colleagues since the early 2000s. It also explains exactly why Sofia plateaued and what fixed it.
Seiler’s research started by looking at how elite endurance athletes — world-class cross-country skiers, rowers, cyclists, runners — actually distribute training intensity in practice. The finding was consistent, and counterintuitive: elite athletes spend roughly 75-80% of training time below their aerobic threshold, in Zones 1-2, and roughly 15-20% above lactate threshold, in Zones 4-5, with very little time in the moderate-intensity black hole — Zone 3 — that most recreational athletes actually live in.
The 2010 Seiler and Tonnessen review pulled this evidence together and laid out the physiological rationale: Zone 2 training builds the aerobic base — mitochondrial density, oxidative enzyme activity, fat oxidation capacity, cardiac stroke volume — without generating the fatigue that would eat into recovery and total training volume. Zone 4-5 training generates the high-intensity adaptations — VO2 max, elevated lactate threshold, neuromuscular speed — that Zone 2 alone can’t touch. Zone 3 generates moderate fatigue while sitting in neither optimal zone — too hard to permit high aerobic volume, too easy to trigger the high-intensity adaptations of Zones 4-5. Polarized training avoids Zone 3 as a default, reserving it for race-specific work and the occasional threshold session rather than treating it as the daily bread and butter.
Subsequent intervention studies comparing polarized training — 80/0/20 across low/medium/high intensity — against threshold training (predominantly Zone 3) have consistently found polarized training produces superior VO2 max improvements, better time-trial performance, and lower injury rates in both recreational and moderately trained athletes. The effect sizes aren’t marginal — they’re meaningful, and they’ve been replicated across multiple research groups.
For Sofia, the implication was direct. Her eleven hours of weekly Zone 3 training were producing real fatigue — which explains why training felt so heavy — without building adequate aerobic base, which explains the run plateau. Restructuring to eight hours of Zone 2 plus ninety minutes of Zones 4-5 reduced her overall training stress while increasing both the aerobic base stimulus and the high-intensity adaptation stimulus at the same time. The four-minute improvement was the predictable outcome of training smarter, not just harder.
Zone 2 is where your aerobic engine is built over weeks and months. Zone 5 is where it’s tested and pushed to its current ceiling. Zone 3 is where most recreational athletes spend most of their time and wonder persistently why they’re not improving. The physiological arithmetic here is not subtle.
Zone 2: The Most Important and Most Neglected Training Zone
Zone 2 earns extended discussion because it’s simultaneously the most important zone for long-term endurance development and the one most recreational athletes chronically avoid — not from ignorance, but because it feels too easy to take seriously.
Zone 2 specifically develops mitochondrial density — mitochondria per muscle fiber — and mitochondrial function, meaning how efficiently those mitochondria produce ATP through aerobic oxidation. Mitochondria are where aerobic metabolism happens; more of them, working better, translates directly into higher fat oxidation rates, better lactate clearance, and greater aerobic power at any given heart rate. These specific adaptations happen in Zone 2, not Zones 3-5 — the intensity itself is the stimulus.
Iñigo San Millán’s research, developed working with professional cyclists including Tadej Pogacar, has put Zone 2 forward as the foundation of aerobic development. His work on metabolic efficiency shows high-volume Zone 2 training improving fat oxidation rates and mitochondrial function in ways that carry over into better performance at every intensity — including the high-intensity efforts in Zones 4-5. High-intensity work builds on top of an aerobic base. Without the base underneath, the high-intensity work runs into a ceiling fast.
The identity problem with Zone 2 is real, and worth naming directly. It feels genuinely easy. Conversation flows without effort. No hard breathing. It feels like it could go on all day. It doesn’t feel like “real training” — and in a culture that equates suffering with effort and effort with virtue, training that doesn’t hurt is a hard sell as productive. That’s the psychological barrier keeping most recreational athletes stuck in Zone 3: hard enough to feel like work, too easy to build the aerobic base they actually need.
The practical test for Zone 2 is simple. You should be able to speak in full, comfortable sentences the whole way through. Not gasping between words, not concentrating on the act of speaking — genuinely comfortable conversation. Pausing mid-sentence to breathe means Zone 2’s been exceeded. If speaking takes zero thought and the effort feels almost trivial, that’s probably Zone 1. The nasal breathing test works too — if nose breathing alone is comfortable, that’s usually Zone 2 or below.
The Zone-Based Training Program

Step 1: Determine Your True Max HR and Thresholds
- Field test option: after a proper warm-up (20+ minutes of progressive effort), complete a 20-30 minute maximum sustainable effort — time trial or hard interval set. Average HR of the final 20 minutes approximates lactate threshold HR. Max HR can be roughly estimated from this plus 5-10% for most people.
- Karvonen formula: measure resting HR across 3 consecutive mornings, average it. Combine with tested or estimated max HR. Calculate zones as percentages of heart rate reserve plus resting HR.
- Lab test option: graded exercise test with lactate or gas exchange analysis nails VT1 and VT2 precisely. Gold standard, where available.
- Recalibrate every 3-6 months — thresholds shift upward as fitness improves.
Step 2: Structure Weekly Training Distribution
- Target 75-80% of total training time in Zones 1-2. This is the aerobic base volume driving mitochondrial and cardiovascular adaptation.
- Target 15-20% of total training time in Zones 4-5. Two to three quality high-intensity sessions weekly, each with 20-40 minutes of combined interval time, not counting warm-up and cooldown.
- Minimize Zone 3 to race-specific work, tempo maintenance, or specific competition prep. It’s not the default training intensity.
- Monitor by session type, not just feel. Log zone distribution using HR data and review it weekly. Most athletes are surprised how much time they actually spend above Zone 2 on days they’d have called easy.
Step 3: High-Intensity Session Structure
- VO2 max intervals (Zone 5): 4-8 x 3-5 minutes at maximum sustainable effort, 2-3 minutes rest between. Best 1-2x/week during high-intensity phases.
- Threshold intervals (Zone 4): 2-3 x 10-20 minutes at 88-93% max HR, 3-5 minutes rest. Improves lactate threshold. Once weekly maximum during maintenance phases.
- Always finish a proper warm-up (15+ minutes of Zone 1-2) before starting high-intensity work, and cool down afterward. Zone 5 without adequate warm-up is an injury risk and reduces the quality of the work itself.
Step 4: Zone 2 Discipline
- Genuinely commit to Zone 2 on easy days — not “mostly Zone 2 with the occasional Z3 surge.” Flat terrain helps; hills push heart rate into Zone 3-4 automatically. Walk the steep uphills, or pick flat routes for Zone 2 sessions.
- Expect Zone 2 to feel embarrassingly slow at first. Athletes coming out of chronic Zone 3 training regularly find their Zone 2 pace is far slower than expected. Normal — it reflects underdeveloped aerobic efficiency, and it improves substantially over 8-12 weeks of consistent Zone 2 work.
- Track pace at Zone 2 heart rate every 4-6 weeks. As aerobic fitness improves, Zone 2 pace increases at the same heart rate — that pace improvement is the direct measure of aerobic base development.
VO2 Max and Zone 5: The High-Intensity Component
VO2 max — the maximum rate of oxygen consumption — is the single best predictor of endurance performance and one of the strongest predictors of all-cause longevity there is. The HUNT study and other large cohorts show high cardiorespiratory fitness (which VO2 max indexes) associated with 40-60% lower all-cause mortality risk compared to low fitness — a risk reduction comparable to quitting smoking.
Zone 5 training, specifically VO2 max intervals, is the most efficient stimulus for VO2 max improvement. Mechanism: training at or near VO2 max forces the cardiovascular system to operate at its current maximal cardiac output, creating the adaptation stimulus for cardiac remodeling (increased stroke volume), peripheral oxygen extraction, and mitochondrial mass. Lower-intensity training in Zones 1-3 doesn’t approach VO2 max, so it doesn’t maximally stimulate these adaptations.
The 4×4 interval protocol — four 4-minute intervals at 90-95% max HR with 3-minute recovery — was specifically studied by Wisløff and colleagues (2007) in cardiac rehabilitation patients, showing superior VO2 max improvements versus moderate-intensity continuous training. This protocol and its variants (3×8 minutes, 6×3 minutes) are among the most evidence-supported high-intensity interval formats for VO2 max development. For more on maximizing VO2 max specifically, see the dedicated VO2 max improvement guide. For the full Zone 2 rationale, see the Zone 2 training guide.
Key integration principle: Zone 5 work builds on the aerobic base Zone 2 provides. Athletes doing exclusively high-intensity training without adequate Zone 2 base find their high-intensity sessions grow more taxing over time as metabolic efficiency declines. Athletes who build the aerobic base first, then layer in Zone 5, get better adaptation with better recovery. Sequence matters here, not just intensity.
Applying Zone Training to Different Sports
The five-zone model was developed primarily from cycling and running research, but the principles carry across virtually all endurance sports. Implementation shifts based on sport-specific factors.
Running: heart rate is an excellent training tool here because effort, pace, and HR track together fairly stably on flat terrain under controlled conditions. Zone 2 running is best done on flat routes or a treadmill, avoiding the automatic intensity bump from hills. Uphill grades push HR above Zone 2 at the same effort level — slow way down on uphills, or walk them, to stay in zone. Pace at a given heart rate is the primary progress metric: a faster mile at the same target HR is the direct measure of aerobic base development.
Cycling: power meters give more precise intensity readings than heart rate because power (watts) is instantaneous, while heart rate lags by 20-30 seconds. On the bike, power zones calibrated from an FTP test outperform HR zones for controlling intensity. Still, HR zones remain valid for cyclists without a power meter and stay useful on long Zone 2 rides, where power averages and HR line up well.
Swimming: heart rate monitoring gets complicated by immersion — water-based optical HR monitors have inconsistent accuracy, and chest strap leads can be used with some compatible devices. Pace per 100m and perceived exertion are the primary intensity controls for swimmers. Zone 2 swimming corresponds to an effort where bilateral breathing stays comfortable and stroke mechanics feel sustainable over a long stretch. High-intensity sets (Zones 4-5) get calibrated by rest interval — shorter rest, higher average intensity — and target pace rather than HR.
Rowing: ergometer rowing provides power (watts), usable analogously to cycling power for zone calibration. On-water rowing relies on stroke rating and perceived effort alongside HR monitoring. Rowing’s unique full-body engagement produces higher HR at a given power output than cycling — zones calibrated from rowing-specific testing outperform crossover figures borrowed from other sports.
Multi-sport athletes: lactate threshold HR can differ between sports because sport-specific muscle mass involvement shifts the HR at which thresholds occur. A runner might have a running VT1 at 140 bpm and a cycling VT1 at 133 bpm. Sport-specific zone calibration produces better training precision than assuming one set of zones applies everywhere.
Periodization and Zone Distribution Over a Training Year
Zone distribution shouldn’t stay static across the year — it should shift with training phase, developing each fitness quality in a deliberate sequence.
Base phase (typically off-season or early prep): the heaviest proportion of Zone 2 work. Volume gets built, aerobic base gets developed. Very little Zone 4-5 — maybe one moderate-intensity session weekly to hold onto neuromuscular sharpness. This phase can run 8-16 weeks for serious endurance athletes. It feels frustratingly slow and easy, which is precisely correct. The urge to add intensity during base phase is one of the most common mistakes recreational athletes make.
Build phase (pre-competition): Zone 2 volume maintained or slightly trimmed; Zone 4 work added systematically. Threshold intervals show up 1-2x/week alongside the aerobic base sessions. VO2 max work gets introduced conservatively. Physiological goal: build lactate threshold and VO2 max on top of the base established earlier. Total training load rises but spreads more broadly across zones.
Race phase (competition season): volume often drops, intensity specificity rises. Intervals target race-specific demands — pacing scenarios, race-intensity bursts, event-specific energy system demands. Zone 2 maintenance continues — can’t neglect the base that powers everything — but proportionally shrinks relative to the build phase. Rest and recovery take increasing priority as competitions stack up.
Recovery phase (post-season): several weeks of dramatically reduced load across every zone. The HPA axis, musculoskeletal system, and psychological motivation all need genuine recovery from a competitive season. Staying at race-phase intensity year-round leads to overtraining syndrome (see the overtraining syndrome guide) and reliably produces plateau or regression the following season. Elite athletes and their coaches treat the recovery phase as non-negotiable — it’s the investment in next season, not a vacation from training.
The periodization principle amplifies the value of zone training by making sure the right zones get emphasized at the right moments. Random training — doing whatever feels right that day across all intensities — produces some adaptation, but it doesn’t systematically develop qualities in the sequence that compounds improvement across seasons.
Heart Rate Variability and Zone Training: The Modern Integration

HRV reflects autonomic nervous system balance — the give-and-take between sympathetic (stress response) and parasympathetic (recovery) activity. High HRV signals good recovery readiness, typically corresponding to a day when moderate-to-high intensity training will be well tolerated and productive. Low HRV signals accumulated stress, incomplete recovery, or oncoming illness — a day when pushing intensity will impair rather than enhance adaptation.
Practical integration: on days when HRV sits at or above the 7-day average, planned intensity sessions can proceed as programmed. On days when HRV runs 10%+ below the 7-day average, consider dropping to Zone 2 or full recovery, regardless of what the written program says. This uses objective daily data to make intensity calls a fixed program simply can’t make, reducing overtraining risk while preserving the adaptation stimulus on genuinely high-readiness days.
Wearables measuring HRV — Whoop, Oura, Garmin HRM with morning measurement protocols — provide this daily readiness data with minimal effort. The key is consistent measurement conditions: same time of day, same body position, ideally upon waking before getting out of bed. Measuring HRV inconsistently throughout the day provides far less useful comparative data than a steady morning baseline.
Combining Zone 2 discipline, polarized intensity distribution, accurate zone calculation, and HRV-guided daily intensity management builds a training system that’s both evidence-based and responsive to individual day-to-day variation. It’s more information than most recreational athletes bother using, but for anyone serious about performance, it’s the difference between training that systematically builds toward a goal and training that produces scattered, inconsistent results.
Practical Challenges: When Heart Rate Data Misleads You
Heart rate as a training metric has limitations that experienced athletes learn to work around.
Cardiac drift: during prolonged Zone 2 exercise, heart rate rises over time even at constant effort, thanks to progressive dehydration, thermoregulation demands, and reduced cardiac stroke volume. A session starting at 135 bpm might drift to 145 bpm after 90 minutes at the same effort. Normal — not a sign of rising intensity. Experienced athletes pace by effort or pace rather than clinging to a rigid heart rate ceiling on long sessions.
Heat and humidity dramatically elevate heart rate at a given effort. Exercise in 90°F/85% humidity can produce Zone 3-4 heart rates at what would normally be Zone 1-2 effort, because the cardiovascular system is juggling thermoregulation on top of everything else. Training by perceived effort rather than strict heart rate targeting in hot conditions prevents undertraining while protecting against heat illness.
Stress, illness, poor sleep, and caffeine all acutely shift heart rate, making a given HR less representative of metabolic intensity than under rested, unstimulated conditions. The athlete who slept badly, drank three cups of coffee, and heads out for a “Zone 2 recovery run” might find their usual easy-effort HR running elevated — not because they’re working harder, but because background sympathetic tone is higher that day. Adjusting for these confounders takes developing feel alongside the data.
Wrist-based optical HR monitors run noticeably less accurate than chest strap monitors, particularly during interval training where rapid HR swings expose lag and error in optical readings. For serious training zone application, a chest strap — Polar, Garmin HRM, Wahoo TICKR — delivers substantially better real-time HR data. The wrist monitor may be fine for steady-state Zone 2 work, but it’s unreliable for capturing peak HR during intervals.
Heart Rate Training: Your Questions Answered
Why is the 220-age formula still everywhere if it’s so inaccurate?
Because it’s simple, requires no testing, and is “good enough” for general fitness guidance for most people most of the time. For recreational exercisers whose training doesn’t hinge on precision, the zone estimates from 220-age are close enough to produce health benefits without the error becoming performance-limiting. For serious athletes training for performance specifically, the formula’s inaccuracy is significant enough to warrant proper testing. It persists because the industry needs a simple default requiring zero effort — not because it’s accurate.
Is Zone 2 training boring?
Yes, by design. Zone 2 is, by definition, a comfortable, sustainable intensity — which is exactly why it’s so effective for long-duration aerobic base work. Podcasts, audiobooks, conversation with a training partner, scenic routes — all compatible with Zone 2 effort. Plenty of athletes who embrace Zone 2 find it becomes their most psychologically sustainable training — finishing sessions feeling good rather than depleted, which supports long-term consistency. The boredom problem is real but entirely solvable with the right content and company; the zone’s aerobic development effectiveness isn’t in scientific question.
How do I know if I’m in Zone 2 without a heart rate monitor?
The talk test is the simplest marker: full, comfortable sentences without pausing to breathe. The nasal breathing test: can you breathe entirely through the nose without discomfort? If so, likely Zone 2 or below for most people. The “all day” test: does the effort feel sustainable indefinitely? Zone 2 should feel like it could continue for hours without serious glycolytic stress. If the effort has a clear endpoint sensation — “I couldn’t keep this up much longer” — that’s probably Zone 3 or above.
Should I use heart rate zones for strength training?
Heart rate zones as defined for endurance training don’t map directly onto resistance training the same way. Resistance training raises heart rate through different mechanisms — muscular tension, Valsalva, pressor response — that don’t correspond to the aerobic/anaerobic thresholds behind endurance zones. For strength training, rest periods, perceived exertion, and tonnage are more meaningful programming variables than a heart rate zone target.
How long does it take to see Zone 2 improvements?
Meaningful aerobic base improvement — faster pace at Zone 2 heart rate — is typically visible within 6-10 weeks of consistent Zone 2 training at adequate volume (5+ hours weekly). The underlying mitochondrial adaptations start within the first 2-4 weeks but take 8-12 weeks to fully show up in measurable performance terms. Athletes coming out of chronic Zone 3 training may find Zone 2 pace embarrassingly slow before the improvement kicks in — that patience requirement is the single biggest compliance barrier.
What happened to Sofia’s next race?
She finished in 4:58 — four minutes faster than her previous best, exactly matching the run split. She’d trained less hard in the perceived-effort sense than the previous two years, but smarter. The Zone 2 base work built the mitochondrial and metabolic efficiency her aerobic engine needed; the twice-weekly Zone 4-5 intervals maintained and developed her lactate threshold and VO2 max. The restructuring felt wrong at first — those Zone 2 runs seemed too easy to be accomplishing anything — and then at ten weeks the data showed her Zone 2 pace had climbed forty-five seconds per mile at the same heart rate, and she understood the aerobic engine had actually been built. The four-minute improvement in the race was proof that engine had finally been given the fuel it earned.
The Practical Framework: Applying Heart Rate Training Zones In Real Life
References
Editorial StandardsCorrectionsMedical DisclaimerAbout Our ContentAffiliate DisclosureSite Map