
Order the wrong test and you’re not just out the money. You walk away with a half-picture that points you at the wrong fix. That’s the real cost of the HRV vs Resting Heart Rate decision — each one is reading a different instrument, and confusing them wastes both.

Both have legitimate clinical uses. The question was never which one is “better” in the abstract. It’s which one answers the question your body is asking right now.
Functional medicine opened a door conventional medicine mostly keeps shut. More testing options, though, means more decisions — and more chances to drop money on the wrong one. Here’s an honest comparison of the two tools, limitations included, the ones the marketing conveniently skips.
What follows: what each test actually measures, its accuracy and limits, cost and accessibility, who should prioritize which, and how to use the results once they’re in hand.
Neither of these is new science dressed up in a new app. Both trace back decades, and understanding where they came from clarifies what they were actually built to answer before a wearable company repackaged them as a daily score on a phone screen.
WHAT IS HRV?

The specific number a wearable spits out at 6 AM is downstream of a heartbeat-to-heartbeat measurement that used to require a hospital-grade ECG and a research assistant with a stopwatch. The modern standard for how to measure and report it comes from a 1996 joint publication — the Task Force of the European Society of Cardiology and the North American Society of Pacing and Electrophysiology, published in Circulation and European Heart Journal, titled, plainly, “Heart Rate Variability: Standards of Measurement, Physiological Interpretation, and Clinical Use.” That paper is still the reference point three decades later. It’s the reason RMSSD (root mean square of successive differences between heartbeats) became the dominant short-duration metric, over the older SDNN (standard deviation of NN intervals) which needs a longer recording window to mean anything. If a wearable app quotes “HRV” without saying which of these it’s using, that’s worth noticing — RMSSD and SDNN aren’t interchangeable, and a device switching its underlying calculation between firmware updates can make a trend line look like it moved when nothing in the body actually did.
The physiological story underneath the number is vagal. The vagus nerve — the main conduit of the parasympathetic nervous system — puts continuous, beat-to-beat braking pressure on the heart via acetylcholine acting on the sinoatrial node. A heart with strong, responsive vagal tone doesn’t fire at a metronomic pace. It speeds up slightly on the inhale, slows on the exhale — a phenomenon called respiratory sinus arrhythmia — and that oscillation is a big part of what RMSSD is actually picking up. Lose vagal responsiveness — through chronic stress, poor sleep, illness, overtraining, alcohol, age — and the beat-to-beat interval flattens out. The heart starts behaving more like a metronome. That flattening is what a “low HRV” morning actually represents at the tissue level: a nervous system with less flexible control over one of its most basic functions.
There’s a cognitive layer to this too, which most HRV marketing skips entirely. Thayer and Lane’s 2000 paper in the Journal of Affective Disorders, “A Model of Neurovisceral Integration in Emotion Regulation and Dysregulation,” proposed that HRV isn’t just a cardiac readout — it’s a proxy for how well the prefrontal cortex is exerting inhibitory control over more reactive subcortical structures, the amygdala chief among them. Higher resting HRV correlates with better performance on cognitive tasks requiring inhibition and emotional regulation. Lower HRV correlates with worse. Which means the “recovery score” on a wrist isn’t purely a muscle-and-heart metric. It’s partly a read on how much bandwidth the prefrontal cortex has available that day — a plausible mechanism for why a genuinely stressful week at work tanks HRV even when training load and sleep duration haven’t changed.
Sport science picked this up fast. Finnish researchers running HRV-guided training studies in the late 2000s — Kiviniemi and colleagues, published across several papers in the European Journal of Applied Physiology — found that endurance athletes who adjusted daily training intensity based on morning HRV readings outperformed athletes running an identical, pre-planned training block regardless of readiness. Same total training stimulus, roughly. Different sequencing. The HRV-guided group got better results because hard days landed on days the nervous system could actually absorb them, and easy days landed on days it couldn’t. That’s the entire pitch behind every “readiness score” a wearable now generates automatically — it’s real science, just automated and simplified to the point where most users never see the actual mechanism behind the traffic-light color on their app.
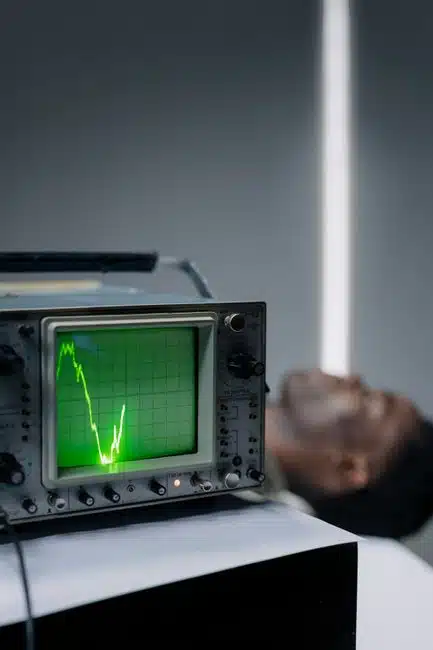
Resting Heart Rate is exactly what it sounds like: heartbeats per minute at complete rest, measured first thing in the morning. Lower generally means fitter — elite endurance athletes commonly sit at 40-50bpm. Useful as a long-term trend, a rough read on fitness and cardiovascular health. But it moves slowly, weeks to months, which makes it close to useless for deciding what to do today.
| HRV | Resting Heart Rate | |
|---|---|---|
| What it measures | Variation between consecutive heartbeats (ms, RMSSD) | Heartbeats per minute at complete rest |
| Signals | Recovery readiness, autonomic balance, daily stress load | Long-term fitness trend (elite endurance athletes: 40-50bpm) |
| Responsiveness | Sensitive day-to-day readiness metric | Moves slowly — weeks to months |
RHR is older than modern cardiology as a discipline. Physicians have been counting a pulse at the wrist or throat for as long as medicine has existed in any organized form, and the practice of taking it first thing in the morning — before caffeine, before movement, before the day’s stress has a chance to elevate it — predates any wearable by a couple of centuries. What changed isn’t the measurement. It’s the volume of data collected on ordinary people over long stretches of time, which is what turned RHR from a bedside curiosity into a population-level risk marker.
The single biggest contributor to that shift is the Framingham Heart Study, launched in 1948 in Framingham, Massachusetts, and still running, now tracking a third generation of the original cohort’s descendants. Framingham is where most of what’s now taken for granted about cardiovascular risk factors — cholesterol, blood pressure, smoking — got its first rigorous, longitudinal evidence base, and resting heart rate came along for the ride as one of the tracked variables. Decades of Framingham data, along with dozens of studies it inspired, consistently show elevated RHR tracking with worse cardiovascular outcomes independent of other risk factors.
Cooney and colleagues put a number on it in a 2010 paper in the American Heart Journal: healthy men and women with a resting heart rate above roughly 75 beats per minute carried close to double the cardiovascular mortality risk of those sitting under 60bpm. Not people with existing heart disease. Healthy people. A resting number most would consider unremarkable — “yeah, mine’s usually in the 70s” — sitting on a materially worse long-term risk curve than someone whose resting number lives in the 50s. Jouven and colleagues, publishing in the New England Journal of Medicine in 2005, looked specifically at heart-rate profile during exercise — how fast it rises, how fast it recovers — as a predictor of sudden cardiac death, and found the recovery-rate piece in particular carried real predictive weight, reinforcing that this isn’t only about the resting number in isolation but about how responsive the whole system is around it. The BEAUTIFUL trial, led by Fox and colleagues and published around 2008 in The Lancet, looked at RHR specifically in patients with existing coronary artery disease and found it behaved as a modifiable risk marker — bring it down pharmacologically in that population and outcomes improved, which is part of why heart-rate-lowering medications occupy the place they do in cardiology for certain patients.
None of that is really about a 34-year-old checking his Whoop before coffee, though it’s the reason RHR earned its reputation as a meaningful long-term marker rather than trivia. For a healthy man without cardiovascular disease, the relevant mechanism is athletic bradycardia — the well-documented phenomenon where sustained endurance training remodels the heart itself. The left ventricle enlarges through eccentric hypertrophy, meaning it gets better at filling with blood and ejecting a larger stroke volume per beat. A heart that pumps more blood per beat doesn’t need to beat as often to move the same total volume, so resting rate drops as a direct mechanical consequence. Layer on top of that an increase in resting vagal tone from sustained aerobic training, which further suppresses the sinoatrial node’s intrinsic firing rate, and you get the 40s-and-below resting rates seen in elite endurance athletes — not a fragile heart, an efficient one.
HRV VS RESTING HEART RATE: WHICH TEST GIVES YOU BETTER INFORMATION

The gap between these two runs deeper than the surface-level comparisons suggest. Quick reference points below; the real decision-making material is in the breakdown that follows. Use the table to orient. Read the analysis for the rest of it.
Here’s the plainest way to frame the actual difference. HRV is a microphone pressed against the nervous system, picking up static that shifts hour to hour. RHR is a photograph of the cardiovascular system’s overall build, taken slowly, developing over months. Ask HRV what today should look like and it’ll answer, sometimes with more nuance than is comfortable. Ask it whether your heart got fitter over the last two years and it’ll shrug — that’s not the question it’s built to answer, and the daily noise will bury any slow trend unless the data gets averaged out over a long window anyway. Ask RHR what today should look like and it has almost nothing to offer, because a resting rate that dropped from 62 to 58 over four months doesn’t tell you a single thing about whether today is a squat-heavy day or a walk-and-stretch day.
DETAILED BREAKDOWN: WHERE EACH ONE WINS
What Each Test Actually Measures
HRV measures specific biomarkers tied to one particular system. Knowing exactly what those markers represent — and what they don’t — is what keeps you from over-reading the result. Every test has a scope. Respect it and you won’t draw conclusions the data was never built to support.
Concretely: HRV is reading autonomic balance, specifically parasympathetic (vagal) output relative to sympathetic drive, at the moment of measurement. It is not reading VO2 max. It is not reading how many miles were logged last week. It is not, on its own, a diagnosis of overtraining, anxiety, or illness — it’s a signal that something in the balance shifted, and the job of figuring out what shifted still belongs to the person reading it. A single low reading after a rough night’s sleep and a single low reading three days before symptomatic illness can look identical on the graph. Context does the differentiating, not the number.
Resting Heart Rate is measuring something else entirely. The overlap between the two is smaller than most people assume, which is exactly why they’re complementary rather than competing. Knowing what RHR uniquely reveals tells you when it’s the better place to start.
RHR is reading cardiac efficiency and structural adaptation — stroke volume, ventricular size, baseline sympathetic tone — averaged out over a much longer window than any single morning captures. It moves the way a coastline moves. Slowly, and mostly in one direction if the underlying training and lifestyle inputs stay consistent, with the occasional storm (illness, a bad stretch of drinking, a period of chronic under-sleeping) pushing it the wrong way temporarily. A single morning’s RHR reading, taken alone, is genuinely close to meaningless.
The trend over eight to twelve weeks is where the signal lives.
Clinical Accuracy and Limitations
No test is perfect. HRV carries its own sensitivity and specificity profile, which determines how much weight the result can actually bear. False positives, false negatives, ranges that shift by device and methodology — all of it affects interpretation. A single reading is a data point. Not a diagnosis. The better practitioners weigh it alongside symptoms and history, not instead of them.
The accuracy problem with HRV is bigger than most users realize, and it splits into two separate issues that get conflated constantly. The first is device accuracy. Chest-strap ECG monitors — a Polar H10 is the usual reference standard cited in validation studies — capture the electrical signal of the heart directly and produce genuinely research-grade RMSSD numbers. Wrist-worn optical sensors, the kind built into an Oura ring, a Whoop strap, or an Apple Watch, infer heartbeat timing from blood-volume changes detected through the skin using photoplethysmography (PPG). PPG is a reasonable proxy at rest, in stillness, in good skin contact. It degrades noticeably during movement, in cold hands, on darker skin tones where signal absorption differs, and in anyone with looser-fitting hardware. None of that means wrist-based HRV is useless. It means the absolute number from a wrist device and the absolute number from a chest strap on the same body, on the same morning, will not match — sometimes by a wide margin — and comparing across devices is comparing two different instruments, not two readings of the same thing.
The second issue is worse, and almost nobody selling a wearable mentions it: there is no meaningful universal “normal range” for HRV. Nunan, Sandercock, and Brodie ran a systematic review published in Pacing and Clinical Electrophysiology in 2010, pooling reported normal HRV values across dozens of studies, and found the reported ranges varied so widely — driven by differences in age, measurement duration, posture, time of day, and methodology across studies — that a single “healthy adult” range is essentially not usable at the individual level. A 45-year-old man with an RMSSD in the 30s might be sitting exactly where his own physiology should sit, while a 28-year-old with an RMSSD in the 80s might be nowhere near his own healthy baseline. Comparing your number to a friend’s, or to some population average an app displays, tells you close to nothing. Comparing today’s number to your own 60-day rolling average tells you something real. This is the single most common misreading of HRV data, and it’s baked into how most consumer apps present the number — a big score on a screen, implicitly inviting comparison to some universal scale that doesn’t actually exist in the research.
There’s a further wrinkle that trips up even experienced trackers: HRV can rise in genuinely bad circumstances, not just good ones. Plews and colleagues documented a case study around 2012 involving an elite rower moving into a state of parasympathetic overtraining — a less commonly discussed form of overreaching where, instead of the nervous system tipping sympathetic (the more familiar “overtrained and wired” picture), it tips heavily parasympathetic, and HRV actually climbs alongside declining performance and mounting fatigue. An athlete or a coach reading “higher HRV, must be recovering well” in that scenario would draw exactly the wrong conclusion. It’s not the common failure mode — most low performance shows up as low HRV, not high — but it’s real enough that the confident “green means go” interpretation some apps push deserves a little skepticism, especially in anyone training at real volume.
Resting Heart Rate has its own accuracy profile, its own limitations. Knowing which results are solid and which are merely suggestive keeps you from over-treating or under-treating based on one number. Ask any practitioner who orders these which markers they trust least — the good ones will tell you straight.
RHR’s accuracy limitations are more about timing and confounders than about instrument error. A wearable’s overnight average RHR is generally reliable — heart rate during sleep is a fairly clean signal, less prone to motion artifact than daytime PPG readings. The confounders are lifestyle: alcohol the night before elevates RHR measurably the next morning, sometimes by five to ten beats per minute, through a combination of dehydration, disrupted sleep architecture, and direct sympathetic activation. Illness — even a mild cold before symptoms fully present — elevates it. Heat, poor sleep, a late heavy meal, all nudge it upward temporarily. None of that invalidates the metric. It means a single morning’s number sitting a few beats higher than usual is far more likely to be one of those transient factors than a sign anything structural has changed, and the trend line is what actually carries diagnostic weight.
Actionability of Results
A test is worth what you can do with it. HRV produces data that leads to specific, targeted interventions when something’s off. The more direct the line from result to action, the more the test is worth. Some markers point somewhere obvious. Others just mean: look closer.
HRV’s actionability is genuinely strong, which is the main reason it’s earned the reputation it has in sport science. A markedly below-baseline reading has a short, sensible list of plausible interventions attached to it — back off training intensity today, prioritize sleep tonight, reconsider the alcohol from last night, check in on stress load this week. That’s a short menu, and most of the items on it are free. Compare that to a lot of blood-panel markers, where an abnormal result often kicks off a longer, more expensive diagnostic chain before any action is clear. HRV rarely requires that. It’s closer to a smoke detector than a biopsy — it tells you to look, not exactly what you’ll find.
Resting Heart Rate has its own actionable range. Some results point straight at an intervention; others are red flags that mean “investigate further,” nothing more. Either way, the best use of a result happens inside a clinical relationship, where a practitioner turns a number into a plan — not a generic supplement stack.
RHR’s actionability is slower and blunter by design. A trend climbing steadily over several months, absent any change in training or major life stress, is a legitimate reason to get a proper cardiovascular workup rather than assume it away. A trend dropping steadily alongside consistent aerobic training is confirmation the training is producing the structural adaptation it’s supposed to. What RHR won’t do is tell you what to change about tomorrow’s workout. It’s a report card, not a coach.
Cost and Accessibility
The cost of HRV — including the consultation needed to interpret it properly — is a real investment. Think past the sticker price: does insurance cover any of it, does it need to be practitioner-ordered, will follow-up testing be needed to track change. Factor in whatever intervention the result ends up suggesting too.
In practice, HRV has gotten radically cheap compared to where it sat even fifteen years ago, when it mostly lived in exercise physiology labs and cost real money per session to measure properly. Now it’s a line item bundled into a $300 ring or a $200-a-year subscription strap, tracked passively overnight with zero additional effort. The honest cost isn’t the device — it’s the two months of patience required before the number means anything, and the discipline required not to overreact to day-one or week-one swings before a real baseline exists.
Resting Heart Rate has its own cost structure. Direct-to-consumer options run cheaper but skip the clinical interpretation that makes a result usable. Practitioner-ordered versions cost more, but come with someone explaining what the number means and what to do about it. For most men, that interpretation is worth more than the test itself.
RHR is close to free. Any wearable tracks it as a side effect of tracking anything else, and a basic pulse count with a watch and a stopwatch costs nothing at all. The barrier here was never cost. It’s patience — waiting for a real multi-month trend rather than reacting to a single morning’s number, and knowing when a genuinely concerning trend warrants an actual cardiology visit rather than another data point on a personal spreadsheet.
When to Re-Test
Tracking change over time is where HRV’s real value shows up. One reading gives you a baseline. Serial testing shows trends, treatment response, whether the intervention is actually doing anything. Most markers need 60-90 days before a meaningful shift shows.
HRV isn’t re-tested so much as continuously tracked — that’s the whole point of it being a daily metric rather than a quarterly lab draw. The re-testing question that actually matters is: how long before the rolling baseline itself is trustworthy. Most sport-science protocols use a minimum of two to four weeks of daily readings before treating the rolling average as a real baseline, and the recommendation in this piece leans more conservative — 60 days — specifically because weekday/weekend patterns, monthly stress cycles, and training-block variation take longer than two weeks to fully surface. Re-baseline again after any major life change: a new job, a training-plan overhaul, a period of illness, a significant change in alcohol habits. The old baseline stops being a fair comparison point the moment the underlying life circumstances shift meaningfully.
The re-testing cadence for Resting Heart Rate runs on similar logic but not identical timing — some markers move fast, some take months. Knowing the difference is what keeps you from re-testing too soon (wasted money) or too late (missed trend).
RHR moves slower than HRV by a wide margin. Meaningful structural change from a new training block — the kind driven by actual cardiac remodeling — usually needs eight to twelve weeks of consistent aerobic work before it shows up reliably in the resting number. Checking weekly is mostly noise. Checking monthly, and looking at a rolling average rather than any single day, is where the real signal lives.
STRENGTHS AND WEAKNESSES OF HRV
Strengths:
- Directly measures the markers most relevant to its target system
- Provides specific data that leads to targeted interventions
- Well-established in functional and integrative medicine
- Results are interpretable with proper clinical context
Weaknesses:
- Limited to its specific scope — doesn’t reveal everything
- Interpretation requires a qualified practitioner
- Cost can be prohibitive without insurance coverage
- Single test represents a snapshot, not a trend
Worth adding to that weakness list, since it’s the one that trips up the most people in practice: HRV is genuinely noisy day to day, and that noise is not a flaw in the measurement — it’s an accurate reflection of a nervous system that responds to dozens of inputs simultaneously. A single bad reading two days after a great one isn’t a contradiction. It’s the metric doing exactly what it’s supposed to do. Men who check the number obsessively and treat each daily swing as meaningful information tend to end up more anxious, not better informed — which is its own kind of irony for a stress-monitoring tool.
STRENGTHS AND WEAKNESSES OF RESTING HEART RATE
Strengths:
- Reveals a different dimension of health data
- May catch issues that the alternative test misses entirely
- Useful as both a standalone and complementary assessment
- Growing evidence base supporting clinical utility
Weaknesses:
- Own set of accuracy limitations and potential for misinterpretation
- Cost is an investment that needs to produce actionable information
- Quality of results varies by lab and methodology
- Requires clinical context to avoid over-treatment based on isolated markers
Add to that: RHR carries the strongest independent long-term mortality data of the two, and it’s the one worth mentioning to an actual physician if the trend is genuinely climbing over months without an obvious lifestyle explanation. That’s not the kind of finding a wearable app is built to flag appropriately — it’ll show a graph trending the wrong way with the same neutral tone it uses for everything else, without conveying that this specific slow climb is the one pattern in either metric with hard cardiovascular-mortality data behind it.
WHEN TO CHOOSE HRV
HRV is the superior daily metric for anyone training seriously who wants real information about intensity, volume, and recovery on a given day. An Oura Ring or Whoop hands you this passively, overnight, no effort required. Track a personal baseline for 60-plus days, then let deviations from it govern the training decisions.
Prioritize HRV when the primary symptoms line up with the system it measures, when a practitioner recommends it off the clinical picture, or when baseline data is needed before a targeted intervention starts. Also reach for HRV first when symptoms are localized to the area it assesses — starting narrow often saves both time and money.
Take a guy we’ll call Danny — 36, runs a small electrical contracting business, lifts four days a week and adds two easy runs, wears an Oura ring mostly because his brother-in-law wouldn’t shut up about his own readiness scores at Thanksgiving. First month, Danny checks the app every single morning and reads meaning into every fluctuation. Score dips from 82 to 61 after a normal Tuesday — no obvious cause, nothing changed that he can point to — and he skips his scheduled squat session out of caution, tells himself he’s “listening to his body.” Does that three more times over five weeks. Training volume quietly collapses to about half of what he’d planned. He isn’t sick. He isn’t injured. He’s reacting to noise inside a baseline that hasn’t even stabilized yet, because two or three weeks isn’t enough data for a 36-year-old’s actual range to reveal itself, and a single day’s dip inside a normal range isn’t a signal at all.
What actually helped Danny wasn’t a supplement or a new recovery gadget. It was sitting down with eight weeks of data at once, plotting the rolling seven-day average instead of staring at the daily number, and noticing his real baseline sat somewhere around 55-70 with plenty of normal bounce inside that range — and that the days genuinely worth backing off on were the ones where the seven-day average itself dropped, not the ones where a single morning ticked down. He still trains four days a week. He just stopped treating every Tuesday like a crisis.
WHEN TO CHOOSE RESTING HEART RATE
Resting heart rate is the better metric for long-term cardiovascular monitoring, for tracking fitness gains over months, and for anyone who wants one simple number without wading into HRV’s interpretive complexity. It’s also the right call when comparing overall cardiovascular fitness across time.
Prioritize Resting Heart Rate when symptoms are diffuse or systemic, when HRV has already run and didn’t explain the full picture, or when a practitioner suspects the systems RHR specifically tracks. Also reach for it when the goal is complementing existing data with a different angle on the same body.
There’s also a simpler case for RHR that gets undersold: some men genuinely do not want a daily interpretive project attached to their heart rate. They want one number, checked occasionally, that moves in a sensible direction if training is going well. That’s a legitimate preference, not a lesser one. A guy training consistently for cardiovascular health rather than competitive performance loses almost nothing by skipping HRV entirely and just watching his morning RHR drift from the low 60s into the mid-50s over a year of consistent zone-2 work. Simple, low-maintenance, and the data underneath it — Framingham-derived, decades deep — is arguably more solid than anything HRV can currently claim on the mortality-risk side specifically.
COMMON MISTAKES MEN MAKE WITH THIS DECISION
- Ordering tests without a clear clinical question. Testing everything on the menu is expensive, and it tends to surface incidental findings that create anxiety without improving anything. Start with symptoms. Form a hypothesis. Order the test that actually evaluates it. Targeted testing beats shotgun panels every time.
- Interpreting results without professional guidance. Lab ranges, methodology differences, the interplay between markers — all of it needs trained eyes. Self-diagnosing off Google and a single number is how men end up with unnecessary supplements, missed diagnoses, wasted money. Pay for the interpretation, not just the test.
- Testing once and never following up. A single result is a starting point, not a conclusion. The real value shows up in tracking change — after diet shifts, supplementation, lifestyle intervention. Budget for at least one follow-up 60-90 days out.
- Comparing your number to someone else’s. This deserves its own line because it’s the single most common misuse of HRV specifically, and it’s baked into how social the wearable-app ecosystem has become. A buddy posting his 95 HRV score means nothing about what a healthy number looks like on a different nervous system, different age, different training history, different genetics. Nunan’s 2010 review exists precisely because researchers noticed how wildly “normal” varies between individuals. Your number against your own trend is the only comparison that carries information. Your number against a stranger’s is closer to comparing shoe sizes and calling the smaller one broken.
- Reacting to single-day swings. Covered above with Danny’s case, but worth stating as its own rule: one bad HRV morning is not a training decision. It’s a data point. The decision belongs to the trend.
- Ignoring the confounders before assuming pathology. A resting-rate spike the morning after a wedding open bar isn’t a cardiovascular event in progress. Rule out the obvious — alcohol, poor sleep, heat, illness, a late heavy meal — before treating any single elevated reading as a medical concern.
HOW TO MAKE THIS DECISION FOR YOURSELF
Start with the symptoms, not the test menu. Write down the top 3-5 complaints. For each one, ask: would this test directly measure something that could explain it. Whichever test has the most direct line to the dominant complaints goes first.
Working with a practitioner? Ask them to explain the reasoning behind recommending one test over the other. Good ones will connect the test to the specific clinical picture and say what they expect to find and how they’d act on different results. If they can’t articulate that, they may be ordering out of habit rather than reasoning.
Budget matters too, practically speaking. Can afford one test now and another in three months? Start with whichever is most likely to reveal something actionable given the current symptom pattern. Use those results to guide treatment, then re-evaluate whether the second test is even still necessary. Sometimes the first one tells you enough.
Practically, for most men outside a clinical context, the choice isn’t really either/or — most decent wearables track both simultaneously at no extra cost. The actual decision is which one gets your attention day to day. If the goal is optimizing training load week to week, HRV earns the daily glance and RHR gets checked monthly as a sanity check. If the goal is long-term cardiovascular health with minimal fuss, flip that — RHR gets the attention, HRV sits in the background as a nice-to-have. Either way, set the check-in cadence before starting, not after three weeks of daily obsessive checking reveals that daily obsessive checking wasn’t actually serving the goal.
MAKING TEST RESULTS ACTUALLY USEFUL
A result without context is just a number. The value of either HRV or Resting Heart Rate depends entirely on what happens after. Before ordering anything, have a plan: if the result shows X, do Y; if it shows Z, do W. That decision tree is what turns testing from data collection into an actual decision-making tool. Skip it, and you end up with expensive information gathering dust.
Reference ranges on a lab report are population averages, not optimal ranges. A result inside “normal” can still be functioning suboptimally. This is where a practitioner who works in functional ranges rather than purely pathological ones earns their fee. The gap between normal and optimal is where most preventable decline quietly happens.
Track results over time. One test is a snapshot. Serial testing — every 3-6 months — shows trends, and trends carry more information than any single data point ever will. A marker sitting inside range but trending the wrong way deserves attention before it becomes a problem. A marker that was flagged and is now climbing back confirms the intervention is working. Snapshots miss the story. Trends tell it.
Budget realistically. The test itself is only part of the bill. Add practitioner consultation for interpretation, follow-up testing to confirm or track progress, and the cost of whatever intervention the results point toward. A $400 test that leads to a $200 consultation and $100 a month in targeted supplementation for six months is a $1,200 commitment. Know that going in, and make sure the potential payoff justifies it.
One more practical note worth including, since it’s rarely explained anywhere the wearable is sold: HRV readings should be taken under identical conditions every time — same time of day (first thing on waking, before getting out of bed, is standard), same position (supine or seated, pick one and stay consistent), same device. A reading taken standing up will differ meaningfully from one taken lying down, because posture itself shifts autonomic balance — this is the basis of the old-school “orthostatic HRV test,” where the shift from lying to standing is measured deliberately as its own diagnostic. Most consumer wearables handle this automatically by only reading during sleep, which is actually one of their genuine advantages over manual chest-strap sessions — less room for the user to introduce inconsistency by accident.
THE BOTTOM LINE: LET YOUR SYMPTOMS GUIDE THE DECISION
Track both, honestly — they’re answering different questions. HRV says how the recovery is going today. RHR trend says how the cardiovascular fitness is moving over months. Together, they’re the fuller picture of autonomic and cardiovascular health.
Let symptoms lead. If the complaints point toward one system, start with the test that measures it directly. If the picture’s broader, or the first test came back clean, the second often catches what got missed. Men who can afford both should run them together — it’s the most complete read available. Choosing just one? Talk to a functional medicine practitioner about which test actually matches the clinical picture in front of them. The right test at the right time beats ten wrong ones ordered out of curiosity.
Neither number, on its own, replaces a real conversation with someone who can read the whole picture — training history, sleep, stress, bloodwork, family history. What both numbers are good for is catching the drift before it becomes a crisis. A slowly rising RHR over six months is worth a conversation with a doctor regardless of how good the Framingham data behind it is or isn’t understood by the man staring at his own graph. A collapsing HRV baseline that never recovers between training blocks is worth a real look at whatever’s actually going on in life outside the gym — because the nervous system doesn’t distinguish between a hard deadlift session and a hard quarter at work. It just registers load, and eventually, it tells you when there’s been too much of it for too long.
References
Editorial StandardsCorrectionsMedical DisclaimerAbout Our ContentAffiliate DisclosureSite Map