
Ordering the wrong health test wastes money and — worse — gives incomplete information that leads to misguided interventions. The CGM vs Standard Blood Sugar Testing decision matters because each reveals a different slice of the health picture.

Both tests have legitimate clinical applications. The question isn’t which is “better” in the abstract. It’s which one answers the specific question the body is asking right now.
Functional medicine has given men access to testing that goes far beyond what conventional medicine typically offers. But more testing options mean more decisions — and more opportunities to spend money on the wrong test. What follows is an honest comparison of these two tools, including the limitations that marketing materials conveniently leave out.
What follows compares what each test actually measures, its accuracy and limitations, cost and accessibility, who should prioritize it, and how to use the results effectively.
Take a guy we’ll call Nathan. Thirty-eight, software architect, ran a 5.4% HbA1c at his annual physical — comfortably in the normal range, doctor didn’t say a word about it. He put on a CGM out of curiosity more than concern. First morning back, a bowl of instant oatmeal with a banana, and the sensor showed a spike to 191 mg/dL forty minutes later, followed by a crash to 68 an hour after that — the kind of glucose rollercoaster that leaves a man reaching for coffee and a second breakfast by ten a.m. without ever knowing why. His HbA1c never caught any of it, because HbA1c is an average, and averages hide exactly this kind of swing.
WHAT IS CGM?

The mechanism is worth understanding, because it explains both why CGM is useful and where its numbers can mislead. The sensor doesn’t measure blood glucose directly — it measures glucose in the interstitial fluid just beneath the skin, which lags actual blood glucose by roughly five to ten minutes. During a fast rise (right after a high-glycemic meal) or a fast fall (during intense exercise), that lag means the number on the phone screen is describing where blood glucose was several minutes ago, not where it is right now. Manufacturers report accuracy using MARD — mean absolute relative difference, the average percentage gap between sensor readings and reference blood draws. Freckmann and colleagues’ accuracy studies put Abbott’s Libre 3 around a 9.2% MARD and Dexcom’s G7 around 8.2%, both considered clinically acceptable (under 10% is the generally accepted threshold for a device to guide treatment decisions in diabetic populations), but neither is perfect, and both are less accurate in the first 12-24 hours after sensor insertion while the tissue around the sensor is still settling.
Compression lows are the other quirk worth knowing before trusting an alarming overnight reading. Sleeping on the arm where the sensor sits can physically compress the tissue, producing a false low that has nothing to do with actual glucose. It’s common enough that most CGM apps now flag a “possible compression low” automatically, but a man checking his data in the morning and seeing a 54 mg/dL overnight low that never triggered any symptoms should treat it skeptically rather than panicking.
The single most influential piece of research behind CGM’s use in non-diabetics is Hall, Snyder, and colleagues’ 2018 study in PLOS Biology, “Glucotypes reveal new patterns of glucose dysregulation,” out of Michael Snyder’s lab at Stanford. They put CGMs on 57 people without diabetes and found that a meaningful subset showed what they termed “severe” glucotype patterns — substantial glucose variability and high peaks after standard meals like a banana or a bowl of cornflakes — despite normal fasting glucose and normal HbA1c on conventional testing. In other words, a real chunk of the “metabolically healthy” population, by every standard test available, is walking around with glucose dysregulation that only becomes visible with continuous data. That’s the study that put CGM-for-non-diabetics on the map, and it’s the reason a lot of functional and longevity-focused practitioners now consider a 14-day wear closer to a baseline metabolic screen than a niche biohacking gadget.
Key metrics CGM produces that standard testing simply cannot: Time in Range (TIR), the percentage of the day spent in a target window, usually 70-180 mg/dL for people managing diabetes but tightened to something like 70-140 mg/dL for non-diabetics chasing metabolic optimization; glycemic variability, often expressed as a coefficient of variation, with anything above roughly 36% flagged as high variability in the research literature; and Mean Amplitude of Glycemic Excursions (MAGE), which captures how dramatic the swings are rather than just where the average sits. A man can have a perfectly normal average glucose across two weeks while spending large chunks of his day swinging between 70 and 180 — a pattern invisible to any single blood draw.
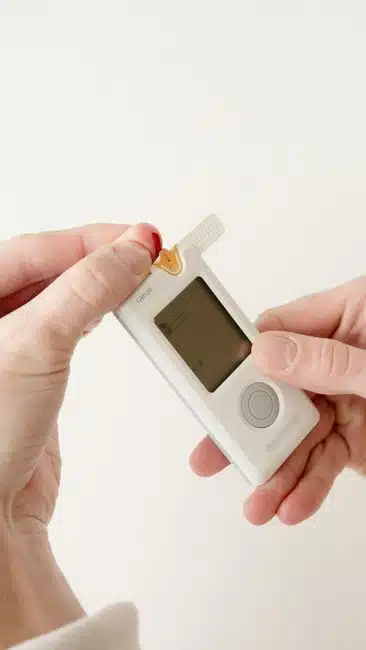
Standard blood sugar testing includes fasting glucose (one morning reading), HbA1c (a 90-day average), and OGTT (oral glucose tolerance test). These are the tools conventional medicine uses and they catch frank diabetes. But they’re blind to reactive hypoglycemia, postprandial spikes, and the metabolic dysfunction that precedes diabetes by years. A fasting glucose of 95 mg/dL looks normal; a CGM might show that same person spiking to 180 mg/dL after oatmeal.
| Test | What It Shows | Cost | Blind Spot |
|---|---|---|---|
| CGM | Continuous interstitial glucose every few minutes, 14-day trend | $50-80 per 14-day wear | N/A — catches spikes standard testing misses |
| Standard (fasting/HbA1c/OGTT) | Single-point or 90-day-average readings | Typically covered by insurance | Blind to reactive hypoglycemia and postprandial spikes |
HbA1c works by measuring the percentage of hemoglobin proteins that have glucose non-enzymatically attached to them — glycation — which accumulates over a red blood cell’s roughly 120-day lifespan, weighted more heavily toward the most recent 30 days since older red blood cells are constantly being replaced. That weighting is worth knowing because it means HbA1c responds faster to recent changes than the “90-day average” framing usually implies, but it also means the number can be quietly distorted: anemia, recent blood loss, blood transfusion, and hemoglobinopathies like sickle cell trait all skew HbA1c independent of actual glucose control, sometimes substantially. A man with undiagnosed mild anemia can carry an HbA1c that looks better than his actual glucose exposure warrants, because his red blood cells simply aren’t sticking around long enough to accumulate as much glycation.
Diagnostic thresholds matter here too, and most men have never actually seen them laid out. Normal fasting glucose is under 100 mg/dL; 100-125 mg/dL is prediabetes; 126 mg/dL or above on two separate occasions is diabetes. HbA1c under 5.7% is normal; 5.7-6.4% is prediabetes; 6.5% or above is diabetes. The OGTT — 75 grams of glucose consumed after an overnight fast, with blood drawn at baseline, one hour, and two hours — remains the gold standard for catching glucose dysregulation that fasting glucose alone misses, since a person can have textbook-normal fasting glucose and still fail to clear a glucose load properly two hours later. It’s also the most burdensome test to actually get done — most primary care physicians only order it for gestational diabetes screening in pregnant women or when prediabetes is already strongly suspected, which means the average non-diabetic man asking for one at a routine physical will often get pushback.
What standard testing structurally cannot see: reactive hypoglycemia, where glucose crashes below 70 mg/dL two to four hours after a high-glycemic meal, producing the shakiness, irritability, and sudden hunger a lot of men chalk up to “just needing to eat” without realizing it’s a glucose event; the magnitude and frequency of postprandial spikes, since nobody gets blood drawn 45 minutes after breakfast during a routine physical; and overnight patterns like the dawn phenomenon, where growth hormone and cortisol trigger a glucose rise in the early morning hours before waking, which is a completely normal circadian pattern in most people but can be exaggerated in those with developing insulin resistance.
CGM VS STANDARD BLOOD SUGAR TESTING: WHICH TEST GIVES YOU BETTER INFORMATION

The differences between CGM and Standard Blood Sugar Testing go deeper than most surface-level comparisons suggest. A quick-reference table only gets you so far; the real decision-making information lives in the detailed breakdown that follows. Use the table for orientation, then read the analysis for the full picture.
DETAILED BREAKDOWN: WHERE EACH ONE WINS
What Each Test Actually Measures
CGM measures specific biomarkers that provide direct information about a particular system or function. Understanding exactly what these markers represent — and what they don’t — prevents misinterpretation. Every test has a scope, and respecting that scope keeps conclusions from outrunning the data.
Concretely, CGM measures glucose dynamics — the shape of the curve, not just a single point on it. It cannot tell you HbA1c directly (though some apps estimate it from average glucose, a calculation called “estimated A1c” that’s a rough approximation, not a lab-grade value), and it says nothing about insulin levels themselves, which is a real gap — a man can have a perfectly flat glucose curve while his pancreas is quietly pumping out three times the insulin a healthy person would need to achieve that same flat curve, a state called compensated insulin resistance that CGM alone will never catch.
Standard Blood Sugar Testing measures a different set of markers targeting different aspects of health. The overlap between these two tests is smaller than most people assume, which is why they’re complementary rather than competing. Knowing what Standard Blood Sugar Testing uniquely reveals helps determine when it’s the better starting point for the investigation.
Standard testing’s HbA1c is the only tool of the two with decades of outcome data attached to specific numeric thresholds — the diagnostic cutoffs for diabetes and prediabetes are built on HbA1c and fasting glucose, not glucose variability metrics, which is why a doctor managing diabetes risk will always want an HbA1c regardless of what a CGM shows. CGM is the newer instrument; HbA1c is the one with the epidemiological track record behind its numbers.
Clinical Accuracy and Limitations
No test is perfect. CGM has specific sensitivity and specificity characteristics that determine how much trust the results deserve. False positives, false negatives, and ranges that vary by lab and methodology all affect interpretation. A single test result is a data point, not a diagnosis. The best practitioners use test results alongside symptoms, history, and other data.
Beyond the interstitial lag and compression lows already covered, sensor accuracy also degrades slightly toward the end of the 14-day wear period, and different sensors calibrate differently — a Dexcom G7 and a Libre 3 worn simultaneously on the same person will produce readings that track closely but rarely match exactly. For the purpose of spotting patterns (which meals spike, how long recovery takes, whether variability is trending down over weeks), that level of precision is more than sufficient. For anyone trying to use CGM data to make insulin dosing decisions — which is a medical use case requiring a prescription and physician oversight, not a biohacking one — the margin of error matters considerably more.
Standard Blood Sugar Testing has its own accuracy profile with its own set of limitations. Understanding which results are highly reliable and which are merely suggestive helps avoid both over-treatment and under-treatment. Ask any practitioner who orders these tests what they consider the most and least reliable markers — good ones will be transparent about the limitations.
Fasting glucose’s core limitation is that it’s a single point in time, sensitive to what was eaten the night before, sleep quality, and even the stress of getting blood drawn (a genuine phenomenon sometimes called “white coat hyperglycemia,” a cousin of white coat hypertension). HbA1c’s limitation, beyond the anemia and hemoglobinopathy interference already mentioned, is that two people can carry the identical HbA1c while having very different glucose curves — one with stable, moderate glucose all day, the other swinging wildly between hypoglycemic and hyperglycemic ranges but averaging out to the same number. HbA1c cannot distinguish between those two very different — and differently risky — metabolic pictures.
Actionability of Results
The value of a test is measured by what can be done with the results. CGM provides data that leads to specific, targeted interventions when abnormalities are found. The clearer the path from test result to action, the more valuable the test. Some markers suggest obvious next steps; others require additional investigation before action is warranted.
This is where CGM genuinely shines relative to any other metabolic test available. Seeing a specific breakfast spike glucose to 190 mg/dL creates an immediate, testable, personal experiment: swap the oatmeal for eggs and see what the curve does tomorrow. Most men who wear a CGM for the first time make at least one permanent dietary change within the first week, purely because the feedback loop is immediate and visual in a way a lab value drawn three days ago and reported a week later simply isn’t.
Standard Blood Sugar Testing produces its own set of actionable data. Some results point directly to specific interventions; others serve as red flags that warrant deeper investigation. The best use of any test result is within a clinical context where a qualified practitioner translates numbers into a personalized plan rather than a generic supplement protocol.
An HbA1c of 6.1% is actionable in the sense that it confirms prediabetes and justifies a serious intervention — but it gives no guidance on which specific foods, meal timing patterns, or exercise windows are driving the number up. It’s a verdict without a mechanism. That’s the tradeoff: standard testing tells a man whether he has a problem with more diagnostic authority; CGM tells him what’s actually causing it.
Cost and Accessibility
The cost of CGM, including the consultation needed to properly interpret results, represents a real investment. Consider not just the sticker price but whether insurance covers any portion, whether the test needs to be ordered by a practitioner, and whether follow-up testing will be needed to track changes. Factor in the cost of any interventions the results suggest.
Accessibility has changed considerably in the past couple of years. Insurance typically only covers CGM for diagnosed diabetics, particularly those on insulin — a non-diabetic wanting one for metabolic optimization has historically needed either an out-of-pocket prescription through a telehealth service or a workaround through a longevity-focused clinic. That’s shifted with the arrival of over-the-counter CGMs aimed specifically at non-diabetics — Abbott’s Lingo and Dexcom’s Stelo both launched as non-prescription options, priced in that same $50-90 per two-week sensor range, explicitly marketed for the biohacking and metabolic-curiosity crowd rather than diabetes management. That’s made CGM the more accessible of the two tests for a healthy man who simply wants to look, in a way that wasn’t true even three years ago.
Standard Blood Sugar Testing has its own cost structure. Direct-to-consumer options may be cheaper but lack the clinical interpretation that makes results actionable. Practitioner-ordered tests cost more but come with guidance on what the numbers mean and what to do about them. For most men, the interpretation is worth more than the test itself.
A fasting glucose and HbA1c panel is inexpensive and often fully covered by insurance as part of a routine annual physical — genuinely the cheapest metabolic data a man can get, assuming he already has a doctor’s visit scheduled anyway. The OGTT, by contrast, is more expensive and time-consuming (roughly two hours in a lab for the full three-draw version) and rarely something insurance will approve without a specific clinical indication.
When to Re-Test
Tracking changes over time multiplies the value of CGM. A single snapshot gives a baseline; serial testing shows trends, treatment response, and whether interventions are working. The optimal re-testing interval depends on what’s being tracked and what interventions have been implemented. Most markers need 60-90 days to reflect meaningful change.
Because a single CGM wear only lasts 10-14 days, the more relevant question isn’t “when to retest” so much as “how often to wear one.” A common pattern among men using CGM as an ongoing optimization tool: one extended wear to establish baseline patterns and identify problem foods, then a check-in wear every three to six months to confirm the changes have held, particularly after a significant diet or training change.
The re-testing cadence for Standard Blood Sugar Testing depends on similar factors but may differ based on the biological half-life of what’s being measured. Some markers change quickly; others require months. Understanding these timelines prevents premature re-testing (wasting money) and delayed re-testing (missing important trends).
Because HbA1c reflects roughly 90 days of glucose exposure, retesting sooner than three months will mostly just re-measure the same underlying period and won’t reflect a new intervention’s full effect. Standard practice for someone actively working to reverse prediabetes is a repeat HbA1c at three months, with fasting glucose checked more frequently if there’s reason to monitor more closely.
STRENGTHS AND WEAKNESSES OF CGM
Strengths:
- Directly measures the markers most relevant to its target system
- Provides specific data that leads to targeted interventions
- Well-established in functional and integrative medicine
- Results are interpretable with proper clinical context
Weaknesses:
- Limited to its specific scope — doesn’t reveal everything
- Interpretation requires a qualified practitioner
- Cost can be prohibitive without insurance coverage
- Single test represents a snapshot, not a trend
STRENGTHS AND WEAKNESSES OF STANDARD BLOOD SUGAR TESTING
Strengths:
- Reveals a different dimension of health data
- May catch issues that the alternative test misses entirely
- Useful as both a standalone and complementary assessment
- Growing evidence base supporting clinical utility
Weaknesses:
- Own set of accuracy limitations and potential for misinterpretation
- Cost is an investment that needs to produce actionable information
- Quality of results varies by lab and methodology
- Requires clinical context to avoid over-treatment based on isolated markers
What Glucose Spikes Actually Do — The Mechanism Behind Why Any of This Matters
Worth pausing on why a 190 mg/dL spike after oatmeal is something to care about if it’s not diabetic range and it comes back down. Every spike above roughly 140 mg/dL triggers a surge of insulin to bring glucose back down, and repeated large surges — day after day, meal after meal — are the mechanism by which cells become progressively less responsive to insulin’s signal over time, the slow-motion process that eventually becomes diagnosable insulin resistance and, years down the line, type 2 diabetes. There’s also a more immediate mechanism worth knowing: acute glucose spikes generate oxidative stress and transient endothelial dysfunction — a temporary impairment of the blood vessel lining’s ability to dilate properly — that’s measurable within hours of a high-glycemic meal in vascular studies, independent of whether the person involved has diabetes at all. It’s not that a single spike is dangerous. It’s that a life built on repeated daily spikes is doing quiet cumulative damage to the same vascular and metabolic systems years before any standard lab value moves out of range.
The flip side — the crash — matters for a more immediate reason. A sharp drop from 190 down to 68 mg/dL, the kind of pattern Nathan saw with his oatmeal, is exactly the physiological trigger for the shakiness, sudden hunger, and irritability a lot of men experience mid-morning and blame on “just needing coffee.” It’s reactive hypoglycemia, and it’s invisible to fasting glucose and largely invisible to HbA1c, since the crash and the preceding spike tend to average each other out over 90 days into a number that looks unremarkable.
The Marker Neither Test Gives You: Fasting Insulin
There’s a real hole in this whole comparison worth naming directly. Neither CGM nor standard blood sugar testing measures insulin itself, and insulin resistance can be well underway for years before either glucose or HbA1c moves out of range, because a healthy pancreas compensates by producing more and more insulin to keep glucose looking normal — right up until it can’t keep up anymore, at which point glucose finally starts climbing and the whole picture looks like it deteriorated suddenly. It didn’t. It was building the entire time, just invisibly.
HOMA-IR (Homeostatic Model Assessment of Insulin Resistance) closes that gap. It’s a simple calculation — fasting glucose multiplied by fasting insulin, divided by 405 — that estimates insulin resistance directly, and it’s cheap: a fasting insulin add-on to a routine blood draw runs $20-40 in most labs. A HOMA-IR under 1.0 is considered optimal, 1.0-1.9 acceptable, 1.9-2.9 suggests early insulin resistance, and above 2.9 is significant resistance — thresholds established across multiple validation studies comparing HOMA-IR against the euglycemic clamp technique, the invasive gold-standard research method for directly measuring insulin sensitivity. A man with a fasting glucose of 88 mg/dL and a normal HbA1c can still carry a HOMA-IR north of 3.0 if his fasting insulin is running high to hold that glucose number down. That’s a man who looks completely clean on standard testing and would also look reasonably clean on a CGM, since his glucose curve might be well-controlled precisely because his pancreas is compensating so hard. Pairing a fasting insulin draw with either CGM or standard glucose testing catches a category of dysfunction that glucose numbers alone, continuous or not, can miss entirely.
WHEN TO CHOOSE CGM
Anyone who wants to understand how the body responds to specific foods, stress, sleep deprivation, and exercise — in real time — will find a CGM transformative. Even a single 14-day wear can permanently change how a man eats. A check-in wear every 6 months is a common pattern among men who’ve made a habit of it.
Prioritize CGM when the primary symptoms align with the system it measures, when a qualified practitioner recommends it based on the clinical picture, or when baseline data is needed before starting a targeted intervention. Also choose CGM first if symptoms are more localized to the specific area it assesses, since starting with the more targeted test often saves time and money.
Specific signals that make CGM the better starting point: energy crashes in the mid-morning or mid-afternoon that track with meal timing, a strong sweet tooth that feels compulsive rather than habitual (often a downstream effect of reactive hypoglycemia driving cravings for fast glucose), a family history of type 2 diabetes with otherwise normal labs, or simply wanting to know which specific foods in a personal diet are metabolically friendly versus not — since the same food produces wildly different glucose responses in different people, a phenomenon well-documented in Segal and Elinav’s team’s 2015 personalized nutrition research out of the Weizmann Institute, published in Cell, which found identical meals produced dramatically different glycemic responses across individuals based on their unique gut microbiome composition. There’s no way to know an individual’s personal response to a given food without actually measuring it.
WHEN TO CHOOSE STANDARD BLOOD SUGAR TESTING
Standard testing is sufficient as a baseline screen and for tracking HbA1c over years. It’s the right call for simply checking diabetes risk at an annual physical. But it will not catch the subclinical dysfunction that a CGM reveals.
Prioritize Standard Blood Sugar Testing when symptoms are more diffuse or systemic, when CGM has already been run without explaining the full picture, or when a practitioner suspects involvement of the systems Standard Blood Sugar Testing specifically measures. Also choose Standard Blood Sugar Testing to complement existing test data with a different perspective on the underlying health picture.
It’s also the right call, and arguably the only appropriate one, when there’s a real suspicion of diabetes already forming — a strong family history combined with classic symptoms like excessive thirst, frequent urination, or unexplained weight loss warrants a proper diagnostic workup with fasting glucose, HbA1c, and likely an OGTT, not a two-week sensor wear and a dietary experiment. CGM is a tool for optimization and pattern-finding in someone who is metabolically healthy or borderline. It is not a diagnostic substitute once diabetes is a genuine clinical concern.
COMMON MISTAKES MEN MAKE WITH THIS DECISION
- Ordering tests without a clear clinical question. Testing everything available is expensive and often produces incidental findings that create anxiety without improving health. Start with the symptoms, form a hypothesis, and order the test that best evaluates that hypothesis. Targeted testing produces better outcomes than shotgun panels.
- Interpreting results without professional guidance. Lab ranges, methodology differences, and the interplay between markers require trained interpretation. Self-diagnosing based on Google and a test result can lead to unnecessary supplementation, missed diagnoses, and wasted money. Invest in the interpretation, not just the test.
- Testing once and never following up. A single test result is a starting point, not an endpoint. The real value emerges from tracking changes over time — after dietary changes, supplementation, or lifestyle interventions. Budget for at least one follow-up test 60-90 days after intervention.
- Panicking over a single CGM spike without context. A spike to 160 mg/dL after a large mixed meal is not, on its own, a red flag — it’s the recovery curve that matters more than the peak. A spike that returns to baseline within two hours is a fundamentally different pattern than one that stays elevated for four, even if the peak number looks identical. Nathan spent his first three days convinced something was seriously wrong with him before realizing his recovery curves were actually fine — it was specifically refined carbohydrate breakfasts eaten alone, without protein or fat, that produced the ugly spikes. Meals with the same carbohydrate content but built around protein first barely moved the needle.
HOW TO MAKE THIS DECISION FOR YOURSELF
Start with the symptoms, not the test menu. Write down the top 3-5 health complaints. For each one, ask: would this test directly measure something that could explain this symptom? The test with the most direct line to the dominant complaints is the one to order first.
If working with a practitioner, ask them to explain their reasoning for recommending one test over the other. Good practitioners will connect the test to the specific clinical picture and explain what they expect to find and how they’d act on different results. A practitioner who can’t articulate this may be ordering tests by habit rather than clinical reasoning.
Budget also matters practically. If one test is affordable now and another in three months, start with the one most likely to reveal actionable findings based on the current symptom pattern. Use those results to guide treatment, then re-evaluate whether the second test is still necessary. Sometimes the first test reveals enough to direct treatment effectively.
MAKING TEST RESULTS ACTUALLY USEFUL
A test result without context is just a number. The value of either CGM or Standard Blood Sugar Testing depends entirely on what happens with the information afterward. Before ordering any test, have a plan: if the result shows X, do Y; if it shows Z, do W. That decision tree is what turns testing from data collection into a decision-making tool. Without it, the result is expensive information that gathers dust.
Reference ranges on lab reports are population averages, not optimal ranges. A result that falls within the normal range can still indicate suboptimal function. This is where working with a practitioner who understands functional ranges, not just pathological ones, makes a meaningful difference. The gap between normal and optimal is where most preventable health decline happens.
Track results over time. A single test gives a snapshot. Serial testing, every 3-6 months, reveals trends that are far more informative than any single data point. A marker within range but trending the wrong direction warrants attention before it becomes a problem. A marker that was flagged but is improving confirms the intervention is working. Trends tell the story that snapshots miss.
Budget realistically. The test itself is only part of the cost. Factor in practitioner consultation for interpretation, follow-up testing to confirm results or track progress, and the cost of any interventions the results suggest. A $400 test that leads to a $200 consultation and $100 per month in targeted supplementation for six months is a $1,200 commitment. Know this going in and make sure the potential value justifies the investment.
Nathan’s total spend was closer to $160 — two 14-day sensors, no practitioner consultation, just the app’s built-in analytics and a willingness to actually change his breakfast. Not every metabolic problem needs a full clinical workup. Some just need two weeks of honest data and the discipline to act on what it shows. He still overdoes it on weekends — a plate of pancakes at a Sunday brunch with the in-laws isn’t going anywhere — but the daily pattern that was quietly driving his 10 a.m. crash five days a week is gone.
THE BOTTOM LINE: LET YOUR SYMPTOMS GUIDE THE DECISION
Run standard labs annually for the record. But anyone who’s never worn a CGM should do it once — the self-knowledge alone is worth the cost. Most people are shocked by what they see.
Let the symptoms guide the decision. If the primary complaints point toward one system, start with the test that directly measures that system. If the symptoms are broader or the first test comes back normal, the second test often reveals what was missed. For men who can afford both, running them together provides the most complete picture. But choosing just one means talking to a qualified functional medicine practitioner about which test best matches the specific clinical picture. The right test at the right time is worth ten times the wrong test ordered out of curiosity.
References
Editorial StandardsCorrectionsMedical DisclaimerAbout Our ContentAffiliate DisclosureSite Map